UNITED STATES
|
Commission file number
|
0-7818
|
|
INDEPENDENT BANK CORPORATION
|
|
(Exact name of Registrant as specified in its charter)
|
|
MICHIGAN
|
38-2032782
|
|
|
(State or other jurisdiction of incorporation)
|
(I.R.S. employer identification no.)
|
|
4200 East Beltline, Grand Rapids, Michigan
|
49525
|
|
(Address of principal executive offices)
|
(Zip Code)
|
|
Registrant's telephone number, including area code
|
(616) 527-5820 |
|
Common Stock, No Par Value
|
NASDAQ
|
|
(Title of class)
|
(Name of Exchange)
|
| · |
economic, market, operational, liquidity, credit, and interest rate risks associated with our business;
|
| · |
economic conditions generally and in the financial services industry, particularly economic conditions within Michigan and the regional and local real estate markets in which our bank operates;
|
| · |
the failure of assumptions underlying the establishment of, and provisions made to, our allowance for loan losses;
|
| · |
increased competition in the financial services industry, either nationally or regionally;
|
| · |
our ability to achieve loan and deposit growth;
|
| · |
volatility and direction of market interest rates;
|
| · |
challenges we may face in acquiring or integrating other businesses;
|
| · |
the continued services of our management team; and
|
| · |
implementation of new legislation, which may have significant effects on us and the financial services industry.
|
|
2017
|
2016
|
2015
|
||||||||||
|
Interest and fees on loans
|
59.8
|
%
|
57.6
|
%
|
58.6
|
%
|
||||||
|
Other interest income
|
10.0
|
9.6
|
8.2
|
|||||||||
|
Non-interest income
|
30.2
|
32.8
|
33.2
|
|||||||||
|
100.0
|
%
|
100.0
|
%
|
100.0
|
%
|
|||||||
|
Total
Risk-Based
Capital Ratio
|
Tier 1
Risk-Based
Capital Ratio
|
Common
Equity Tier 1
Risk-Based
Capital Ratio
|
Leverage
Ratio
|
|
|
Well capitalized
|
10% or above
|
8% or above
|
6.5% or above
|
5% or above
|
|
Adequately capitalized
|
8% or above
|
6% or above
|
4.5% or above
|
4% or above
|
|
Undercapitalized
|
Less than 8%
|
Less than 6%
|
Less than 4.5%
|
Less than 4%
|
|
Significantly undercapitalized
|
Less than 6%
|
Less than 4%
|
Less than 3%
|
Less than 3%
|
|
Critically undercapitalized
|
Tangible equity to total assets of 2% or less
|
|||
| · |
The Homeowner Affordability and Stability Plan (HASP) was implemented in 2009 to support a recovery in the housing market and ensure that borrowers can continue to pay off their mortgages through initiatives such as access to low-cost refinancing for responsible homeowners suffering from falling home prices; a $75 billion homeowner stability plan to prevent foreclosure, and support of low mortgage rates by strengthening confidence in Fannie Mae and Freddie Mac.
|
| · |
The Dodd-Frank Act, adopted in 2010, included the creation of the Consumer Financial Protection Bureau (CFPB), which was given the power to issue and enforce certain consumer protection laws. The CFPB has issued several new consumer protection regulations, including regulations that impact residential mortgage lending and servicing.
|
| · |
The Dodd-Frank Act also implemented new restrictions on how mortgage brokers and loan originators may be compensated.
|
|
I.
|
(A)
|
DISTRIBUTION OF ASSETS, LIABILITIES AND STOCKHOLDERS' EQUITY;
|
|
(B)
|
INTEREST RATES AND INTEREST DIFFERENTIAL
|
|
|
(C)
|
INTEREST RATES AND DIFFERENTIAL
|
|
2017
|
2016
|
2015
|
||||||||||
|
(in thousands)
|
||||||||||||
|
Trading securities
|
$
|
455
|
$
|
410
|
$
|
148
|
||||||
|
Available for sale
|
||||||||||||
|
Obligations of states and political subdivisions
|
$
|
172,945
|
$
|
170,899
|
$
|
144,984
|
||||||
|
U.S. agency residential mortgage-backed
|
137,918
|
156,289
|
196,056
|
|||||||||
|
Other asset backed
|
93,898
|
146,709
|
116,904
|
|||||||||
|
Corporate
|
47,853
|
56,180
|
38,614
|
|||||||||
|
Private label mortgage-backed
|
29,109
|
34,727
|
4,903
|
|||||||||
|
U.S. agency
|
25,682
|
28,988
|
47,512
|
|||||||||
|
U.S. agency commercial mortgage-backed
|
9,760
|
12,632
|
34,028
|
|||||||||
|
Trust preferred
|
2,802
|
2,579
|
2,483
|
|||||||||
|
Foreign government
|
2,060
|
1,613
|
-
|
|||||||||
|
U.S. Treasury
|
898
|
-
|
-
|
|||||||||
|
Total
|
$
|
522,925
|
$
|
610,616
|
$
|
585,484
|
||||||
|
Maturing
Within One Year |
Maturing
After One But Within Five Years |
Maturing
After Five But Within Ten Years |
Maturing
After Ten Years |
|||||||||||||||||||||||||||||
|
Amount
|
Yield
|
Amount
|
Yield
|
Amount
|
Yield
|
Amount
|
Yield
|
|||||||||||||||||||||||||
|
(dollars in thousands)
|
||||||||||||||||||||||||||||||||
|
Trading securities
|
$
|
455
|
0.00
|
%
|
||||||||||||||||||||||||||||
|
Tax equivalent adjustment
for calculation of yield
|
$
|
-
|
||||||||||||||||||||||||||||||
|
Available for sale
|
||||||||||||||||||||||||||||||||
|
Obligations of states and
political subdivisions
|
$
|
13,603
|
2.37
|
%
|
$
|
67,350
|
2.84
|
%
|
$
|
41,980
|
3.72
|
%
|
$
|
50,012
|
3.43
|
%
|
||||||||||||||||
|
U.S. agency residential
mortgage-backed
|
115
|
0.95
|
53,186
|
1.45
|
28,800
|
1.37
|
55,817
|
2.65
|
||||||||||||||||||||||||
|
Other asset backed
|
51,567
|
2.41
|
23,791
|
1.55
|
17,163
|
1.62
|
1,377
|
1.47
|
||||||||||||||||||||||||
|
Corporate
|
17,023
|
1.67
|
13,966
|
2.62
|
16,864
|
2.32
|
-
|
|||||||||||||||||||||||||
|
Private label mortage
-backed
|
166
|
2.01
|
15,913
|
2.57
|
10,996
|
3.26
|
2,034
|
4.18
|
||||||||||||||||||||||||
|
U.S. agency
|
65
|
2.67
|
10,311
|
1.47
|
15,306
|
2.13
|
-
|
|||||||||||||||||||||||||
|
U.S. agency commercial
|
||||||||||||||||||||||||||||||||
|
mortgage-backed
|
427
|
1.69
|
7,933
|
2.48
|
-
|
1,400
|
2.92
|
|||||||||||||||||||||||||
|
Trust preferred
|
-
|
-
|
-
|
2,802
|
2.10
|
|||||||||||||||||||||||||||
|
Foreign government
|
-
|
2,060
|
6.38
|
-
|
-
|
|||||||||||||||||||||||||||
|
U.S. Treasury
|
898
|
1.27
|
-
|
-
|
-
|
|||||||||||||||||||||||||||
|
Total
|
$
|
83,864
|
2.24
|
%
|
$
|
194,510
|
2.22
|
%
|
$
|
131,109
|
2.53
|
%
|
$
|
113,442
|
2.99
|
%
|
||||||||||||||||
|
Tax equivalent adjustment
for calculation of yield
|
$
|
68
|
$
|
524
|
$
|
290
|
$
|
228
|
||||||||||||||||||||||||
|
Available for sale
|
Tax-Exempt
Rate
|
Adjustment
|
Rate on Tax
Equivalent
Basis
|
||||||
|
Under 1 year
|
1.68%
|
0.91%
|
2.59
|
||||||
|
1-5 years
|
2.00
|
1.08
|
3.08
|
||||||
|
5-10 years
|
2.58
|
1.39
|
3.97
|
||||||
|
After 10 years
|
3.40
|
1.83
|
5.23
|
||||||
|
2017
|
2016
|
2015
|
2014
|
2013
|
||||||||||||||||
|
(in thousands)
|
||||||||||||||||||||
|
Loans held for sale(a)
|
$
|
39,436
|
$
|
67,380
|
$
|
27,866
|
$
|
23,662
|
$
|
20,390
|
||||||||||
|
Mortgage
|
849,530
|
538,615
|
498,036
|
471,435
|
486,115
|
|||||||||||||||
|
Commercial
|
853,260
|
804,017
|
748,398
|
690,955
|
635,234
|
|||||||||||||||
|
Installment
|
316,027
|
265,616
|
234,017
|
207,571
|
192,583
|
|||||||||||||||
|
Payment plan receivables
|
-
|
-
|
34,599
|
40,001
|
60,638
|
|||||||||||||||
|
Total Loans
|
$
|
2,058,253
|
$
|
1,675,628
|
$
|
1,542,916
|
$
|
1,433,624
|
$
|
1,394,960
|
||||||||||
| (a) |
2016 includes $30.6 million of payment plan receivables and $0.8 million commercial loans related to the then pending sale of Mepco and $35.9 million of 1-4 family residential mortgages.
|
|
Due
Within
One Year
|
Due
After One
But Within
Five Years
|
Due
After
Five Years
|
Total
|
|||||||||||||
|
(in thousands)
|
||||||||||||||||
|
Mortgage
|
$
|
8
|
$
|
60
|
$
|
103,112
|
$
|
103,180
|
||||||||
|
Commercial
|
109,255
|
249,915
|
494,090
|
853,260
|
||||||||||||
|
Total
|
$
|
109,263
|
$
|
249,975
|
$
|
597,202
|
$
|
956,440
|
||||||||
|
Fixed
Rate
|
Variable
Rate
|
Total
|
||||||||||
|
(in thousands)
|
||||||||||||
|
Due after one but within five years
|
$
|
115,754
|
$
|
134,221
|
$
|
249,975
|
||||||
|
Due after five years
|
286,262
|
310,940
|
597,202
|
|||||||||
|
Total
|
$
|
402,016
|
$
|
445,161
|
$
|
847,177
|
||||||
|
2017
|
2016
|
2015
|
2014
|
2013
|
||||||||||||||||
|
(in thousands)
|
||||||||||||||||||||
|
(a) Loans accounted for
on a non-accrual basis (1, 2)
|
$
|
8,184
|
$
|
13,364
|
$
|
10,607
|
$
|
15,231
|
$
|
17,905
|
||||||||||
|
(b) Aggregate amount of loans ninety days
or more past due (excludes loans in (a) above)
|
-
|
-
|
116
|
7
|
-
|
|||||||||||||||
|
(c) Loans not included above which are
"troubled debt restructurings" as defined by
accounting guidance
|
60,115
|
70,286
|
81,512
|
102,971
|
114,887
|
|||||||||||||||
|
Total
|
$
|
68,299
|
$
|
83,650
|
$
|
92,235
|
$
|
118,209
|
$
|
132,792
|
||||||||||
| (1) |
The accrual of interest income is discontinued when a loan becomes 90 days past due and the borrower's capacity to repay the loan and collateral values appear insufficient. Non-accrual loans may be restored to accrual status when interest and principal payments are current and the loan appears otherwise collectible.
|
| (2) |
Interest in the amount of $3.79 million would have been earned in 2017 had loans in categories (a) and (c) remained at their original terms; however, only $3.05 million was included in interest income for the year with respect to these loans.
|
|
2017
|
2016
|
2015
|
||||||||||
|
(dollars in thousands)
|
||||||||||||
|
Total loans outstanding at the end of
the year (net of unearned fees)
|
$
|
2,058,253
|
$
|
1,675,628
|
$
|
1,542,916
|
||||||
|
Average total loans outstanding for
the year (net of unearned fees)
|
$
|
1,848,860
|
$
|
1,599,899
|
$
|
1,461,480
|
||||||
|
Loan
Losses
|
Unfunded
Commit-
ments
|
Loan
Losses
|
Unfunded
Commit-
ments
|
Loan
Losses
|
Unfunded
Commit-
ments
|
|||||||||||||||||||
|
Balance at beginning of year
|
$
|
20,234
|
$
|
650
|
$
|
22,570
|
$
|
652
|
$
|
25,990
|
$
|
539
|
||||||||||||
|
Loans charged-off
|
||||||||||||||||||||||||
|
Mortgage
|
1,122
|
2,599
|
2,567
|
|||||||||||||||||||||
|
Commercial
|
455
|
1,317
|
1,694
|
|||||||||||||||||||||
|
Installment
|
1,474
|
1,671
|
1,467
|
|||||||||||||||||||||
|
Payment plan receivables
|
-
|
-
|
-
|
|||||||||||||||||||||
|
Total loans charged-off
|
3,051
|
5,587
|
5,728
|
|||||||||||||||||||||
|
Recoveries of loans previously
charged-off
|
||||||||||||||||||||||||
|
Mortgage
|
1,741
|
1,047
|
1,258
|
|||||||||||||||||||||
|
Commercial
|
1,497
|
2,472
|
2,656
|
|||||||||||||||||||||
|
Installment
|
967
|
1,100
|
1,108
|
|||||||||||||||||||||
|
Payment plan receivables
|
-
|
-
|
-
|
|||||||||||||||||||||
|
Total recoveries
|
4,205
|
4,619
|
5,022
|
|||||||||||||||||||||
|
Net loans charged-off
|
(1,154
|
)
|
968
|
706
|
||||||||||||||||||||
|
Reclassification to loans held for sale
|
-
|
59
|
-
|
|||||||||||||||||||||
|
Additions (deductions) included
in operations
|
1,199
|
475
|
(1,309
|
)
|
(2
|
)
|
(2,714
|
)
|
113
|
|||||||||||||||
|
Balance at end of year
|
$
|
22,587
|
$
|
1,125
|
$
|
20,234
|
$
|
650
|
$
|
22,570
|
$
|
652
|
||||||||||||
|
Net loans charged-off as a percent of
average loans outstanding (includes
loans held for sale) for the year
|
(0.06
|
)%
|
0.06
|
%
|
0.05
|
%
|
||||||||||||||||||
|
Allowance for loan losses as a
percent of loans outstanding (includes
loans held for sale) at the end of the year
|
1.10
|
1.21
|
1.46
|
|||||||||||||||||||||
|
2014
|
2013
|
|||||||
|
(dollars in thousands)
|
||||||||
|
Total loans outstanding at the end of
the year (net of unearned fees)
|
$
|
1,433,624
|
$
|
1,394,960
|
||||
|
Average total loans outstanding for
the year (net of unearned fees)
|
$
|
1,388,772
|
$
|
1,413,796
|
||||
|
Loan
Losses
|
Unfunded
Commit-
ments
|
Loan
Losses
|
Unfunded
Commit-
ments
|
|||||||||||||
|
Balance at beginning of year
|
$
|
32,325
|
$
|
508
|
$
|
44,275
|
$
|
598
|
||||||||
|
Loans charged-off
|
||||||||||||||||
|
Mortgage
|
4,119
|
6,319
|
||||||||||||||
|
Commercial
|
4,613
|
7,358
|
||||||||||||||
|
Installment
|
1,885
|
2,520
|
||||||||||||||
|
Payment plan receivables
|
2
|
35
|
||||||||||||||
|
Total loans charged-off
|
10,619
|
16,232
|
||||||||||||||
|
Recoveries of loans previously charged-off
|
||||||||||||||||
|
Mortgage
|
1,397
|
1,996
|
||||||||||||||
|
Commercial
|
4,914
|
5,119
|
||||||||||||||
|
Installment
|
1,104
|
1,074
|
||||||||||||||
|
Payment plan receivables
|
5
|
81
|
||||||||||||||
|
Total recoveries
|
7,420
|
8,270
|
||||||||||||||
|
Net loans charged-off
|
3,199
|
7,962
|
||||||||||||||
|
Additions (deductions) included in
|
||||||||||||||||
|
operations
|
(3,136
|
)
|
31
|
(3,988
|
)
|
(90
|
)
|
|||||||||
|
Balance at end of year
|
$
|
25,990
|
$
|
539
|
$
|
32,325
|
$
|
508
|
||||||||
|
Net loans charged-off as a percent of
average loans outstanding (includes loans
held for sale) for the year
|
0.23
|
%
|
0.56
|
%
|
||||||||||||
|
Allowance for loan losses as a
percent of loans outstanding (includes loans
held for sale) at the end of the year
|
1.81
|
2.32
|
||||||||||||||
|
2017
|
2016
|
2015
|
||||||||||||||||||||||
|
Allowance
Amount
|
Percent of
Loans to
Total Loans
|
Allowance
Amount
|
Percent
of Loans to
Total Loans
|
Allowance
Amount
|
Percent
of Loans to
Total Loans
|
|||||||||||||||||||
|
(dollars in thousands)
|
||||||||||||||||||||||||
|
Commercial
|
$
|
5,595
|
41.5
|
%
|
$
|
4,880
|
48.0
|
%
|
$
|
5,670
|
48.5
|
%
|
||||||||||||
|
Mortgage
|
8,733
|
43.2
|
8,681
|
34.3
|
10,391
|
34.1
|
||||||||||||||||||
|
Installment
|
864
|
15.3
|
1,011
|
15.9
|
1,181
|
15.2
|
||||||||||||||||||
|
Payment plan receivables(a)
|
-
|
-
|
-
|
1.8
|
56
|
2.2
|
||||||||||||||||||
|
Subjective allocation
|
7,395
|
-
|
5,662
|
-
|
5,272
|
-
|
||||||||||||||||||
|
Total
|
$
|
22,587
|
100.0
|
%
|
$
|
20,234
|
100.0
|
%
|
$
|
22,570
|
100.0
|
%
|
||||||||||||
|
2014
|
2013
|
|||||||||||||||
|
Allowance
Amount
|
Percent
of Loans to
Total Loans
|
Allowance
Amount
|
Percent
of Loans to
Total Loans
|
|||||||||||||
|
(dollars in thousands)
|
||||||||||||||||
|
Commercial
|
$
|
5,445
|
48.2
|
%
|
$
|
6,827
|
45.5
|
%
|
||||||||
|
Mortgage
|
13,444
|
34.5
|
17,195
|
36.3
|
||||||||||||
|
Installment
|
1,814
|
14.5
|
2,246
|
13.8
|
||||||||||||
|
Payment plan receivables
|
64
|
2.8
|
97
|
4.4
|
||||||||||||
|
Subjective allocation
|
5,223
|
-
|
5,960
|
-
|
||||||||||||
|
Total
|
$
|
25,990
|
100.0
|
%
|
$
|
32,325
|
100.0
|
%
|
||||||||
| (a) |
Allowance of $0.06 million related to payment plan receivables was reclassified to loans held for sale at December 31, 2016.
|
|
2017
|
2016
|
2015
|
||||||||||||||||||||||
|
Average
Balance
|
Rate
|
Average
Balance
|
Rate
|
Average
Balance
|
Rate
|
|||||||||||||||||||
|
(dollars in thousands)
|
||||||||||||||||||||||||
|
Non-interest bearing
|
$
|
728,208
|
$
|
688,697
|
$
|
619,206
|
||||||||||||||||||
|
Savings and interest-bearing checking
|
1,052,215
|
0.15
|
%
|
1,018,685
|
0.11
|
%
|
988,504
|
0.11
|
%
|
|||||||||||||||
|
Time
|
502,284
|
1.04
|
447,243
|
0.86
|
386,035
|
0.76
|
||||||||||||||||||
|
Total
|
$
|
2,282,707
|
0.30
|
%
|
$
|
2,154,625
|
0.23
|
%
|
$
|
1,993,745
|
0.20
|
%
|
||||||||||||
|
(in thousands)
|
||||
|
Three months or less
|
$
|
49,504
|
||
|
Over three through six months
|
54,246
|
|||
|
Over six months through one year
|
68,733
|
|||
|
Over one year
|
48,756
|
|||
|
Total
|
$
|
221,239
|
||
|
2017
|
2016
|
2015
|
2014
|
2013
|
||||||||||||||||
|
Net income as a percent of(1)
|
||||||||||||||||||||
|
Average common equity
|
7.82
|
%
|
9.21
|
%
|
7.89
|
%
|
7.43
|
% |
64.22
|
%
|
||||||||||
|
Average total assets
|
0.77
|
0.92
|
0.86
|
0.80
|
3.87
|
|||||||||||||||
|
Dividends declared per share as a
percent of diluted net income per share
|
44.21
|
32.38
|
30.23
|
23.38
|
0.00
|
|||||||||||||||
|
Average shareholders' equity as a percent
of average total assets
|
9.88
|
9.98
|
10.93
|
10.83
|
8.69
|
|||||||||||||||
| · |
variations in quarterly or annual results of operations;
|
| · |
changes in dividends per share;
|
| · |
deterioration in asset quality, including declining real estate values;
|
| · |
changes in interest rates;
|
| · |
significant acquisitions or business combinations, strategic partnerships, joint ventures, or capital commitments by or involving us or our competitors;
|
| · |
regulatory actions, including changes to regulatory capital levels, the components of regulatory capital and how regulatory capital is calculated;
|
| · |
new regulations that limit or significantly change our ability to continue to offer products or services;
|
| · |
volatility of stock market prices and volumes;
|
| · |
issuance of additional shares of common stock or other debt or equity securities;
|
| · |
changes in market valuations of similar companies;
|
| · |
changes in securities analysts' estimates of financial performance or recommendations;
|
| · |
perceptions in the marketplace regarding the financial services industry, us and/or our competitors; and/or
|
| · |
the occurrence of any one or more of the risk factors described above.
|
|
Name (Age)
|
Position
|
First elected
as an executive
officer
|
|
William B. Kessel (53)
|
President, Chief Executive Officer and Director (1)
|
2004
|
|
Robert N. Shuster (60)
|
Executive Vice President and Chief Financial Officer
|
1999
|
|
Stefanie M. Kimball (58)
|
Executive Vice President and Chief Risk Officer
|
2007
|
|
David C. Reglin (58)
|
Executive Vice President, Retail Banking
|
1998
|
|
Dennis J. Mack (56)
|
Executive Vice President and Chief Lending Officer (2)
|
2012
|
|
Larry R. Daniel (54)
|
Executive Vice President, Operations and Digital Banking (3)
|
2017
|
|
Patrick J. Ervin (52)
|
Executive Vice President, Mortgage Banking (4)
|
2017
|
|
James J. Twarozynski (52)
|
Senior Vice President, Controller
|
2002
|
| (1) |
Mr. Kessel assumed the role of President as of April 1, 2011, and assumed the roles of CEO and director starting January 1, 2013. Prior to being appointed President, Mr. Kessel was Executive Vice President and COO.
|
| (2) |
Prior to being named Executive Vice President and Chief Lending Officer in 2012, Mr. Mack was a Senior Vice President and commercial credit officer since 2009 and a Senior Vice President at Comerica Incorporated since 2001.
|
| (3) |
Mr. Daniel joined Independent Bank over 19 years ago as a commercial lender. Prior to being named Executive Vice President – Operations and Digital Banking in November 2017, he served as Senior Vice President of Retail and Mortgage Lending at Independent Bank, a position he held since 2012.
|
| (4) |
Mr. Ervin joined Independent Bank in August 2016, as Senior Vice President – Mortgage Banking. He was promoted to Executive Vice President – Mortgage Banking in November 2017. Prior to joining Independent Bank, Mr. Ervin served as Executive Managing Director Mortgage Banking and Servicing at Talmer Bank and Trust, a position he held since 2009.
|
| ITEM 5. |
MARKET FOR OUR COMMON EQUITY, RELATED STOCKHOLDER MATTERS AND ISSUER PURCHASES OF EQUITY SECURITIES
|
|
Period
|
Total Number of
Shares Purchased(1)
|
Average Price
Paid Per Share
|
Total Number of
Shares Purchased
as Part of a
Publicly
Announced Plan
|
Remaining
Number of
Shares Authorized
for Purchase
Under the Plan
|
||||||||||||
|
October 2017
|
-
|
-
|
-
|
1,062,905
|
||||||||||||
|
November 2017
|
2,371
|
$
|
22.60
|
-
|
1,062,905
|
|||||||||||
|
December 2017
|
-
|
-
|
-
|
-
|
||||||||||||
|
Total
|
2,371
|
$
|
22.60
|
-
|
-
|
|||||||||||
| (1) |
Represents shares withheld from the shares that would otherwise have been issued to a certain officer in order to satisfy tax withholding obligations and the stock option exercise price resulting from the exercise of stock options.
|
| ITEM 6. |
SELECTED FINANCIAL DATA
|
| ITEM 7. |
MANAGEMENT'S DISCUSSION AND ANALYSIS OF FINANCIAL CONDITION AND RESULTS OF OPERATIONS
|
| ITEM 7A. |
QUANTITATIVE AND QUALITATIVE DISCLOSURES ABOUT MARKET RISK
|
| ITEM 8. |
FINANCIAL STATEMENTS AND SUPPLEMENTARY DATA
|
| ITEM 8. |
FINANCIAL STATEMENTS AND SUPPLEMENTARY DATA (continued)
|
| ITEM 9. |
CHANGES IN AND DISAGREEMENTS WITH ACCOUNTANTS ON ACCOUNTING AND FINANCIAL DISCLOSURE
|
| ITEM 9A. |
CONTROLS AND PROCEDURES
|
| 1. |
Evaluation of Disclosure Controls and Procedures. With the participation of management, our chief executive officer and chief financial officer, after evaluating the effectiveness of our disclosure controls and procedures (as defined in Exchange Act Rules 13a – 15e and 15d – 15e) as of the year ended December 31, 2017 (the "Evaluation Date"), have concluded that, as of such date, our disclosure controls and procedures were effective.
|
| 2. |
Internal Control Over Financial Reporting. "Management's Annual Report on Internal Control Over Financial Reporting" and our independent registered public accounting firm's audit of internal control over financial reporting as of December 31, 2017 included within the "Report of Independent Registered Public Accounting Firm," each as set forth in our annual report, to be delivered to shareholders in connection with the April 24, 2018 Annual Meeting of Shareholders (filed as exhibit 13 to this report on Form 10-K) are incorporated herein by reference.
|
| ITEM 9B. |
OTHER INFORMATION
|
| ITEM 10. |
DIRECTORS, EXECUTIVE OFFICERS AND CORPORATE GOVERNANCE
|
| ITEM 11. |
EXECUTIVE COMPENSATION
|
| ITEM 12. |
SECURITY OWNERSHIP OF CERTAIN BENEFICIAL OWNERS AND MANAGEMENT AND RELATED STOCKHOLDER MATTERS
|
|
Plan Category
|
(a)
Number of securities
to be issued upon
exercise of outstanding
options, warrants
and rights
|
(b)
Weighted-average
exercise price of
outstanding options,
warrants and rights
|
(c)
Number of securities
remaining available for
future issuance under
equity compensation
plans (excluding
securities reflected
in column (a))
|
|||||||||
|
Equity compensation plans
approved by security holders
|
176,055
|
$
|
5.24
|
507,823
|
||||||||
|
Equity compensation plan
not approved by security holders
|
None
|
N/A
|
205,785
|
|||||||||
| ITEM 12. |
SECURITY OWNERSHIP OF CERTAIN BENEFICIAL OWNERS AND MANAGEMENT AND RELATED STOCKHOLDER MATTERS (continued)
|
| ITEM 13. |
CERTAIN RELATIONSHIPS AND RELATED TRANSACTIONS, AND DIRECTOR INDEPENDENCE
|
| ITEM 14. |
PRINCIPAL ACCOUNTANT FEES AND SERVICES
|
| ITEM 15. |
EXHIBITS AND FINANCIAL STATEMENT SCHEDULES
|
|
(a)
|
1.
|
Financial Statements
|
|
All of our financial statements are incorporated herein by reference as set forth in the annual report to be delivered to shareholders in connection with the April 24, 2018 Annual Meeting of Shareholders (filed as exhibit 13 to this report on Form 10-K.)
|
||
|
2.
|
Exhibits (Numbered in accordance with Item 601 of Regulation S-K)
|
|
|
The Exhibit Index is located on the final three pages of this report on Form 10-K.
|
| ITEM 16. |
FORM 10-K SUMMARY
|
|
s/Robert N. Shuster
|
Robert N. Shuster, Executive Vice President and Chief Financial Officer (Principal Financial Officer)
|
|
William B. Kessel, President, Chief
Executive Officer, and Director (Principal Executive Officer) |
s/William B. Kessel
|
March 7, 2018
|
|
Robert N. Shuster, Executive Vice
President and Chief Financial Officer (Principal Financial Officer) |
s/Robert N. Shuster
|
March 7, 2018
|
|
James J. Twarozynski, Senior Vice
President and Controller (Principal Accounting Officer) |
s/James J. Twarozynski
|
March 7, 2018
|
|
Michael M. Magee, Jr.
Chairman and Director |
s/Michael M. Magee Jr.
|
March 7, 2018
|
|
William J. Boer, Director
|
|
|
|
Joan A. Budden, Director
|
s/Joan A. Budden
|
March 1, 2018
|
|
Michael J. Cok, Director
|
s/Michael J. Cok
|
March 7, 2018
|
|
Stephen L. Gulis, Jr., Director
|
s/Stephen L. Gulis, Jr.
|
March 7, 2018
|
|
Terry L. Haske, Director
|
s/Terry L. Haske
|
March 7, 2018
|
|
Christina L. Keller, Director
|
s/Christina L. Keller
|
March 7, 2018
|
|
William B. Kessel, Director
|
s/William B. Kessel
|
March 7, 2018
|
|
Matthew J. Missad, Director
|
|
|
|
James E. McCarty, Director
|
s/James E. McCarty
|
March 1, 2018
|
|
Charles C. Van Loan, Director
|
s/Charles C. Van Loan
|
March 2, 2018
|
|
Annual report, relating to the April 24, 2018 Annual Meeting of Shareholders. This annual report will be delivered to our shareholders in compliance with Rule 14(a)-3 of the Securities Exchange Act of 1934, as amended.
|
|
|
List of Subsidiaries.
|
|
|
Consent of Independent Registered Public Accounting Firm (Crowe Horwath LLP).
|
|
|
Power of Attorney (included on page 35).
|
|
|
Certificate of the Chief Executive Officer of Independent Bank Corporation pursuant to Section 302 of the Sarbanes-Oxley Act of 2002.
|
|
|
Certificate of the Chief Financial Officer of Independent Bank Corporation pursuant to Section 302 of the Sarbanes-Oxley Act of 2002.
|
|
|
Certificate of the Chief Executive Officer of Independent Bank Corporation pursuant to Section 906 of the Sarbanes-Oxley Act of 2002.
|
|
|
Certificate of the Chief Financial Officer of Independent Bank Corporation pursuant to Section 906 of the Sarbanes-Oxley Act of 2002.
|
|
Restated Articles of Incorporation (incorporated herein by reference to Exhibit 3.1 to our quarterly report on Form 10-Q filed November 3, 2017).
|
|
|
Amended and Restated Bylaws (incorporated here by reference to Exhibit 3.2 to our annual report on Form 10-K filed March 7, 2017).
|
|
|
The form of Indemnity Agreement, as executed with all of the directors of the registrant (incorporated herein by reference to Exhibit 10.3 to the Form S-4 we filed on December 29, 2017).
|
|
|
The form of Management Continuity Agreement as executed with executive officers and certain senior managers (incorporated herein by reference to Exhibit 10.4 to the Form S-4 we filed on December 29, 2017).
|
|
|
Long-Term Incentive Plan, as amended through January 24, 2017 (incorporated herein by reference to Appendix A to our proxy statement filed on Schedule 14A on March 7, 2017).
|
|
|
Amended and Restated Deferred Compensation and Stock Purchase Plan for Nonemployee Directors, as amended through March 8, 2011 (incorporated herein by reference to Exhibit 10.2 to our annual report on Form 10-K filed March 10, 2011).
|
|
|
First Amendment to Amended and Restated Deferred Compensation and Stock Purchase Plan for Nonemployee Directors, effective March 1, 2012 (incorporated herein by reference to Exhibit 10.1 to our annual report on Form 10-K filed March 13, 2012).
|
|
|
Form of Restricted Stock Unit Grant Agreement as executed with certain executive officers (incorporated herein by reference to Exhibit 10.2 to our quarterly report on Form 10-Q filed May 9, 2011).
|
|
|
Form of TSR Performance Share Award Agreement as executed with certain executive officers (incorporated herein by reference to Exhibit 10.12 to our annual report on Form 10-K filed March 7, 2014).
|
|
|
Summary of Independent Bank Corporation Management Incentive Compensation Plan (incorporated herein by reference to Exhibit 10.10 to our annual report on Form 10-K filed March 6, 2015).
|
|
|
Agreement and Plan of Merger between Independent Bank Corporation and TCSB Bancorp, Inc. (incorporated here by reference to Exhibit 2.1 to our current report on Form 8-K filed December 5, 2017).
|
|
|
Voting Agreement of directors of TCSB Bancorp, Inc., dated December 4, 2017 (incorporated here by reference to Exhibit 10.1 to our current report on Form 8-K filed December 5, 2017).
|
|
Form of Non-Competition and Non-Solicitation Agreement signed by each director of TCSB Bancorp, Inc., dated December 4, 2017 (incorporated here by reference to Exhibit 10.2 to our current report on Form 8-K filed December 5, 2017).
|
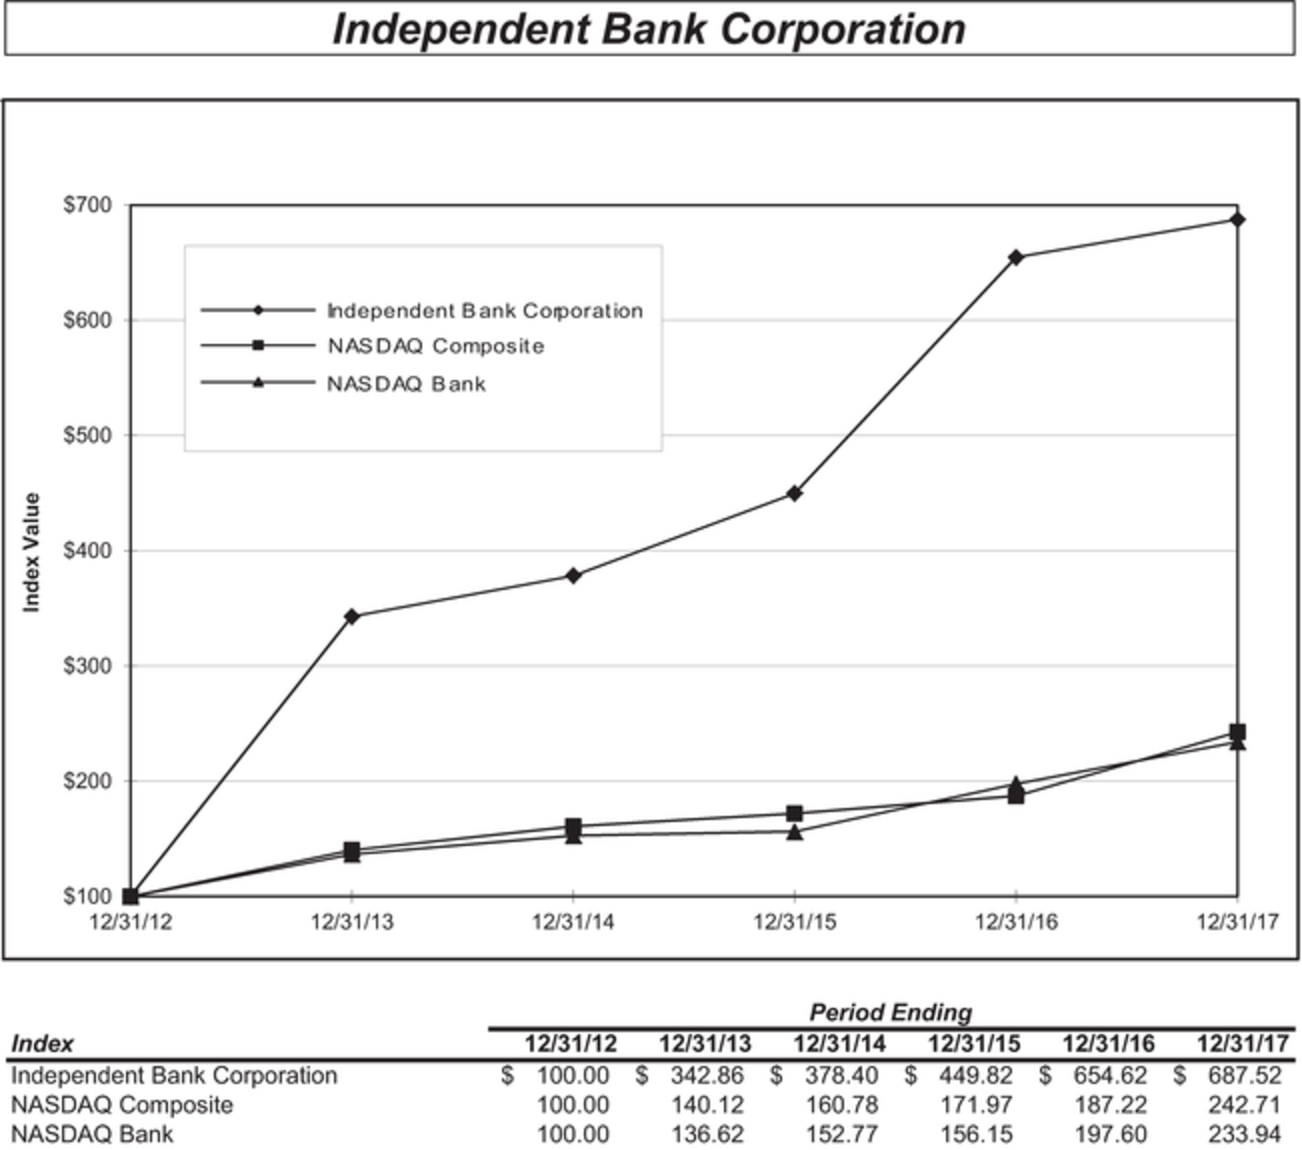
The graph below compares the total returns (assuming reinvestment of dividends) of Independent Bank Corporation common stock, the NASDAQ Composite Index and the NASDAQ Bank Stock Index. The graph assumes $100 invested in Independent Bank Corporation common stock (returns based on stock prices per the NASDAQ) and each of the indices on December 31, 2012 and the reinvestment of all dividends during the periods presented. The performance shown on the graph is not necessarily indicative of future performance.
8
SELECTED CONSOLIDATED FINANCIAL DATA (1)
|
|
Year Ended December 31,
|
||||||||||||||
|
|
2017
|
2016
|
2015
|
2014
|
2013
|
||||||||||
|
|
(Dollars in thousands, except per share amounts)
|
||||||||||||||
|
SUMMARY OF OPERATIONS
|
|
|
|
|
|
|
|
|
|
|
|
|
|
|
|
|
Interest income
|
$
|
98,309
|
|
$
|
86,523
|
|
$
|
80,842
|
|
$
|
80,555
|
|
$
|
87,121
|
|
|
Interest expense
|
|
9,123
|
|
|
6,882
|
|
|
5,856
|
|
|
7,299
|
|
|
9,162
|
|
|
Net interest income
|
|
89,186
|
|
|
79,641
|
|
|
74,986
|
|
|
73,256
|
|
|
77,959
|
|
|
Provision for loan losses
|
|
1,199
|
|
|
(1,309
|
)
|
|
(2,714
|
)
|
|
(3,136
|
)
|
|
(3,988
|
)
|
|
Net gains on securities
|
|
260
|
|
|
563
|
|
|
20
|
|
|
320
|
|
|
369
|
|
|
Net gain on branch sale
|
|
—
|
|
|
—
|
|
|
1,193
|
|
|
—
|
|
|
—
|
|
|
Gain on extinguishment of debt
|
|
—
|
|
|
—
|
|
|
—
|
|
|
500
|
|
|
—
|
|
|
Other non-interest income
|
|
42,273
|
|
|
41,735
|
|
|
38,917
|
|
|
37,955
|
|
|
44,460
|
|
|
Non-interest expenses
|
|
92,082
|
|
|
90,347
|
|
|
88,450
|
|
|
89,951
|
|
|
104,118
|
|
|
Income before income tax
|
|
38,438
|
|
|
32,901
|
|
|
29,380
|
|
|
25,216
|
|
|
22,658
|
|
|
Income tax expense (benefit)
|
|
17,963
|
|
|
10,135
|
|
|
9,363
|
|
|
7,195
|
|
|
(54,851
|
)
|
|
Net income
|
$
|
20,475
|
|
$
|
22,766
|
|
$
|
20,017
|
|
$
|
18,021
|
|
$
|
77,509
|
|
|
Preferred stock dividends
|
|
—
|
|
|
—
|
|
|
—
|
|
|
—
|
|
|
(3,001
|
)
|
|
Preferred stock discount
|
|
—
|
|
|
—
|
|
|
—
|
|
|
—
|
|
|
7,554
|
|
|
Net income applicable to common stock
|
$
|
20,475
|
|
$
|
22,766
|
|
$
|
20,017
|
|
$
|
18,021
|
|
$
|
82,062
|
|
|
|
|
|
|
|
|
|
|
|
|
|
|
|
|
|
|
|
PER COMMON SHARE DATA
|
|
|
|
|
|
|
|
|
|
|
|
|
|
|
|
|
Net income per common share
|
|
|
|
|
|
|
|
|
|
|
|
|
|
|
|
|
Basic
|
$
|
0.96
|
|
$
|
1.06
|
|
$
|
0.88
|
|
$
|
0.79
|
|
$
|
5.87
|
|
|
Diluted
|
|
0.95
|
|
|
1.05
|
|
|
0.86
|
|
|
0.77
|
|
|
3.55
|
|
|
Cash dividends declared and paid
|
|
0.42
|
|
|
0.34
|
|
|
0.26
|
|
|
0.18
|
|
|
0.00
|
|
|
Book value
|
|
12.42
|
|
|
11.71
|
|
|
11.28
|
|
|
10.91
|
|
|
10.15
|
|
|
|
|
|
|
|
|
|
|
|
|
|
|
|
|
|
|
|
SELECTED BALANCES
|
|
|
|
|
|
|
|
|
|
|
|
|
|
|
|
|
Assets
|
$
|
2,789,355
|
|
$
|
2,548,950
|
|
$
|
2,409,066
|
|
$
|
2,248,730
|
|
$
|
2,209,943
|
|
|
Loans
|
|
2,018,817
|
|
|
1,608,248
|
|
|
1,515,050
|
|
|
1,409,962
|
|
|
1,374,570
|
|
|
Allowance for loan losses
|
|
22,587
|
|
|
20,234
|
|
|
22,570
|
|
|
25,990
|
|
|
32,325
|
|
|
Deposits
|
|
2,400,534
|
|
|
2,225,719
|
|
|
2,085,963
|
|
|
1,924,302
|
|
|
1,884,806
|
|
|
Shareholders’ equity
|
|
264,933
|
|
|
248,980
|
|
|
251,092
|
|
|
250,371
|
|
|
231,581
|
|
|
Other borrowings
|
|
54,600
|
|
|
9,433
|
|
|
11,954
|
|
|
12,470
|
|
|
17,188
|
|
|
Subordinated debentures
|
|
35,569
|
|
|
35,569
|
|
|
35,569
|
|
|
35,569
|
|
|
40,723
|
|
|
|
|
|
|
|
|
|
|
|
|
|
|
|
|
|
|
|
SELECTED RATIOS
|
|
|
|
|
|
|
|
|
|
|
|
|
|
|
|
|
Net interest income to average interest earning assets
|
|
3.65
|
%
|
|
3.52
|
%
|
|
3.58
|
%
|
|
3.67
|
%
|
|
4.11
|
%
|
|
Net income to (2)
|
|
|
|
|
|
|
|
|
|
|
|
|
|
|
|
|
Average common equity
|
|
7.82
|
|
|
9.21
|
|
|
7.89
|
|
|
7.43
|
|
|
64.22
|
|
|
Average assets
|
|
0.77
|
|
|
0.92
|
|
|
0.86
|
|
|
0.80
|
|
|
3.87
|
|
|
Average shareholders’ equity to average assets
|
|
9.88
|
|
|
9.98
|
|
|
10.93
|
|
|
10.83
|
|
|
8.69
|
|
|
Tier 1 capital to average assets
|
|
10.57
|
|
|
10.50
|
|
|
10.91
|
|
|
11.18
|
|
|
10.61
|
|
|
Non-performing loans to Portfolio Loans
|
|
0.41
|
|
|
0.83
|
|
|
0.71
|
|
|
1.08
|
|
|
1.30
|
|
| (1) | The significant variations in the results of operations for the five years presented above is a result of a number of factors, including changes in asset quality metrics, our exit from the Troubled Asset Relief Program in 2013 and significant income tax expense/benefits realized in 2017 and 2013. |
| (2) | These amounts are calculated using net income applicable to common stock. |
9
MANAGEMENT’S DISCUSSION AND ANALYSIS OF
FINANCIAL CONDITION AND RESULTS OF OPERATIONS
Disclaimer Regarding Forward-Looking Statements. Statements in this report that are not statements of historical fact, including statements that include terms such as “will,” “may,” “should,” “believe,” “expect,” “forecast,” “anticipate,” “estimate,” “project,” “intend,” “likely,” “optimistic” and “plan” and statements about future or projected financial and operating results, plans, projections, objectives, expectations, and intentions, are forward-looking statements. Forward-looking statements include, but are not limited to, descriptions of plans and objectives for future operations, products or services; projections of our future revenue, earnings or other measures of economic performance; forecasts of credit losses and other asset quality trends; statements about our business and growth strategies; and expectations about economic and market conditions and trends. These forward-looking statements express our current expectations, forecasts of future events, or long-term goals. They are based on assumptions, estimates, and forecasts that, although believed to be reasonable, may turn out to be incorrect. Actual results could differ materially from those discussed in the forward-looking statements for a variety of reasons, including:
| • | economic, market, operational, liquidity, credit, and interest rate risks associated with our business; |
| • | economic conditions generally and in the financial services industry, particularly economic conditions within Michigan and the regional and local real estate markets in which our bank operates; |
| • | the failure of assumptions underlying the establishment of, and provisions made to, our allowance for loan losses; |
| • | increased competition in the financial services industry, either nationally or regionally; |
| • | our ability to achieve loan and deposit growth; |
| • | volatility and direction of market interest rates; |
| • | the continued services of our management team; and |
| • | implementation of new legislation, which may have significant effects on us and the financial services industry. |
This list provides examples of factors that could affect the results described by forward-looking statements contained in this report, but the list is not intended to be all-inclusive. The risk factors disclosed in Part I – Item 1A of our Annual Report on Form 10-K for the year ended December 31, 2017, as updated by any new or modified risk factors disclosed in Part II – Item 1A of any subsequently filed Quarterly Report on Form 10-Q, include all known risks our management believes could materially affect the results described by forward-looking statements in this report. However, those risks may not be the only risks we face. Our results of operations, cash flows, financial position, and prospects could also be materially and adversely affected by additional factors that are not presently known to us that we currently consider to be immaterial, or that develop after the date of this report. We cannot assure you that our future results will meet expectations. While we believe the forward-looking statements in this report are reasonable, you should not place undue reliance on any forward-looking statement. In addition, these statements speak only as of the date made. We do not undertake, and expressly disclaim, any obligation to update or alter any statements, whether as a result of new information, future events, or otherwise, except as required by applicable law.
Introduction. The following section presents additional information to assess the financial condition and results of operations of Independent Bank Corporation (“IBCP”), its wholly-owned bank, Independent Bank (the “Bank”), and their subsidiaries. This section should be read in conjunction with the consolidated financial statements and the supplemental financial data contained elsewhere in this annual report. We also encourage you to read our Annual Report on Form 10-K filed with the U.S. Securities and Exchange Commission (“SEC”). That report includes a list of risk factors that you should consider in connection with any decision to buy or sell our securities.
Overview. We provide banking services to customers located primarily in Michigan’s Lower Peninsula. As a result, our success depends to a great extent upon the economic conditions in Michigan’s Lower Peninsula. At times, we have experienced a difficult economy in Michigan. Economic conditions in Michigan began to show signs of improvement during 2010. Generally, these improvements have continued into 2017, albeit at an uneven pace. There has been an overall decline in the unemployment rate as well as generally improving housing prices and other related
10
statistics (such as home sales and new building permits). In addition, since early- to mid-2009, we have seen an improvement in our asset quality metrics. In particular, since early 2012, we have generally experienced a decline in non-performing assets, lower levels of new loan defaults, and reduced levels of loan net charge-offs.
Recent Developments. On December 22, 2017, President Donald Trump signed into law “H.R. 1”, also known as the “Tax Cuts and Jobs Act”, which among other things, reduced the federal corporate income tax rate to 21% effective January 1, 2018. As a result, we concluded that our deferred tax assets, net (“DTA”) had to be remeasured. Our DTA represents expected corporate tax benefits anticipated to be realized in the future. The reduction in the federal corporate income tax rate reduces these anticipated future benefits. The remeasurement of our DTA at December 31, 2017 resulted in a reduction of these net assets and a corresponding increase in income tax expense of $6.0 million that was recorded in the fourth quarter of 2017.
On December 4, 2017, we entered into an Agreement and Plan of Merger with TCSB Bancorp, Inc. (“TCSB”) (the “Merger Agreement”) providing for a business combination of IBCP and TCSB. The Merger Agreement provides that, upon the terms and subject to the conditions set forth in the Merger Agreement, TCSB will be merged with and into IBCP, with IBCP as the surviving corporation (the “Merger”). In addition, IBCP intends to consolidate Traverse City State Bank, TCSB's wholly-owned subsidiary bank, with and into Independent Bank (with Independent Bank as the surviving institution).
Subject to the terms and conditions of the Merger Agreement, we will pay aggregate Merger consideration of approximately $63.2 million in IBCP common stock or stock options for all of the shares of TCSB common stock and TCSB stock options issued and outstanding immediately before the effective time of the Merger. The Merger consideration is subject to adjustment in certain limited circumstances, as set forth in the Merger Agreement.
Completion of the Merger is subject to certain closing conditions. These include, among others, (i) in the case of both parties, receipt of the requisite approval of TCSB's shareholders, receipt of required regulatory approvals, the absence of any law or order prohibiting completion of the Merger and the absence of a material adverse effect (as defined in the Merger Agreement), and (ii) in the case of IBCP, the consolidated shareholders' equity of TCSB must be at least $33 million (subject to adjustment as provided in the Merger Agreement) as of the final statement date (as defined in the Merger Agreement). The Merger Agreement provides certain termination rights for both IBCP and TCSB and further provides that, upon termination of the Merger Agreement under certain circumstances, TCSB will be obligated to pay IBCP a termination fee of approximately $2.5 million. Currently, we anticipate that the Merger will be effective on or about April 1, 2018. Our 2017 non-interest expenses include $0.3 million of costs incurred through December 31, 2017 related to the Merger.
Effective on January 1, 2017, we adopted the fair value accounting method for capitalized mortgage loan servicing rights. The adoption of this accounting method resulted in the following changes to the January 1, 2017 beginning balances: an increase in capitalized mortgage loan servicing rights of $0.54 million; a decrease in deferred income taxes of $0.19 million and a decrease in our accumulated deficit of $0.35 million. See note #1 to the Consolidated Financial Statements.
On December 30, 2016, the Bank and its wholly-owned subsidiary, Mepco Finance Corporation (“Mepco”), entered into an Asset Purchase Agreement (“APA”) with Seabury Asset Management LLC (“Seabury”). Pursuant to the terms of the APA, we sold our payment plan processing business, payment plan receivables, and certain other assets to Seabury, who also assumed certain liabilities of Mepco. These assets and liabilities were categorized as “held for sale” in the December 31, 2016 Consolidated Statement of Financial Condition. We also recorded a $0.32 million loss related to the sale of these assets in the fourth quarter of 2016. This transaction closed on May 18, 2017, with an effective date of May 1, 2017. As a result of the closing, Mepco sold $33.1 million of net payment plan receivables, $0.5 million of commercial loans, $0.2 million of furniture and equipment and $1.6 million of other assets to Seabury, who also assumed $2.0 million of specified liabilities. Mepco was renamed IB Holding Company in May 2017 and was liquidated on June 30, 2017, with the remaining assets and liabilities transferred to the Bank. We do not believe that the sale of the Mepco business and assets will have a significant impact on our future overall financial condition or results of operations.
In the fourth quarter of 2016, we reached a tentative settlement regarding litigation initiated against the Bank in Wayne County, Michigan Circuit Court. The Court issued a preliminary approval of this settlement in the first quarter of 2017 and a final approval of this settlement in January 2018. This litigation concerned the Bank’s checking account transaction sequencing during a period from February 2009 to June 2011. Under the terms of the settlement, we agreed to pay $2.2 million and we are also responsible for class notification costs and certain other expenses
11
which are estimated to total approximately $0.1 million. The $2.2 million was paid in January 2018. We recorded a $2.3 million expense in the fourth quarter of 2016 for this settlement. Although, we deny any liability associated with this matter and believe we have meritorious defenses to the allegations in the complaint, given the costs and uncertainty of litigation, we determined that this settlement was in the best interests of the organization.
Regulation. On July 2, 2013, the Federal Reserve Board approved a final rule that establishes an integrated regulatory capital framework (the “New Capital Rules”). The rule implements in the United States the Basel III regulatory capital reforms from the Basel Committee on Banking Supervision and certain changes required by the 2010 Dodd-Frank Wall Street Reform and Consumer Protection Act (the “Dodd-Frank Act”). In general, under the New Capital Rules, minimum requirements have increased for both the quantity and quality of capital held by banking organizations. Consistent with the international Basel framework, the New Capital Rules include a new minimum ratio of common equity tier 1 capital to risk-weighted assets of 4.5% and a common equity tier 1 capital conservation buffer of 2.5% of risk-weighted assets that applies to all supervised financial institutions. The 2.5% capital conservation buffer is being phased in ratably over a four-year period that began in 2016. In 2017, 1.25% is being added to the minimum ratio for adequately capitalized institutions. To avoid limits on capital distributions and certain discretionary bonus payments we must meet the minimum ratio for adequately capitalized institutions plus the phased in buffer (now 5.75% in 2017). The rule also raises the minimum ratio of tier 1 capital to risk-weighted assets from 4% to 6% and includes a minimum leverage ratio of 4% for all banking organizations. As to the quality of capital, the New Capital Rules emphasize common equity tier 1 capital, the most loss-absorbing form of capital, and implements strict eligibility criteria for regulatory capital instruments. The New Capital Rules also change the methodology for calculating risk-weighted assets to enhance risk sensitivity. Under the New Capital Rules our existing trust preferred securities are grandfathered as qualifying regulatory capital. As of December 31, 2017 and 2016 we exceeded all of the capital ratio requirements of the New Capital Rules.
It is against this backdrop that we discuss our results of operations and financial condition in 2017 as compared to earlier periods.
12
RESULTS OF OPERATIONS
Summary. We recorded net income of $20.5 million, or $0.95 per diluted share, in 2017, net income of $22.8 million, or $1.05 per diluted share, in 2016, and net income of $20.0 million, or $0.86 per diluted share, in 2015. 2017 results include an additional $6.0 million of income tax expense related to the remeasurement of our DTA as described earlier under “Recent Developments.”
KEY PERFORMANCE RATIOS
|
|
Year Ended December 31,
|
||||||||
|
|
2017
|
2016
|
2015
|
||||||
|
Net income to
|
|
|
|
|
|
|
|
|
|
|
Average common equity
|
|
7.82
|
%
|
|
9.21
|
%
|
|
7.89
|
%
|
|
Average assets
|
|
0.77
|
|
|
0.92
|
|
|
0.86
|
|
|
Net income per common share
|
|
|
|
|
|
|
|
|
|
|
Basic
|
$
|
0.96
|
|
$
|
1.06
|
|
$
|
0.88
|
|
|
Diluted
|
|
0.95
|
|
|
1.05
|
|
|
0.86
|
|
Net interest income. Net interest income is the most important source of our earnings and thus is critical in evaluating our results of operations. Changes in our net interest income are primarily influenced by our level of interest-earning assets and the income or yield that we earn on those assets and the manner and cost of funding our interest-earning assets. Certain macro-economic factors can also influence our net interest income such as the level and direction of interest rates, the difference between short-term and long-term interest rates (the steepness of the yield curve) and the general strength of the economies in which we are doing business. Finally, risk management plays an important role in our level of net interest income. The ineffective management of credit risk and interest-rate risk in particular can adversely impact our net interest income.
Net interest income totaled $89.2 million during 2017, compared to $79.6 million and $75.0 million during 2016 and 2015, respectively. The increase in net interest income in 2017 compared to 2016 primarily reflects a $191.2 million increase in average interest-earning assets and a 13 basis point increase in our tax equivalent net interest income as a percent of average interest-earning assets (the “net interest margin”).
The increase in average interest-earning assets primarily reflects loan growth utilizing funds from increases in deposits and borrowed funds. The increase in the net interest margin reflects a change in the mix of average-interest earning assets (higher percentage of loans) as well as increases in short-term market interest rates.
The increase in net interest income in 2016 compared to 2015 primarily reflects a $173.7 million increase in average interest-earning assets that was partially offset by a six basis point decrease in our net interest margin.
Our net interest income is also impacted by our level of non-accrual loans. Average non-accrual loans totaled $9.5 million, $10.9 million and $13.8 million in 2017, 2016 and 2015, respectively.
13
AVERAGE BALANCES AND RATES
|
|
2017
|
2016
|
2015
|
||||||||||||||||||||||||
|
|
Average
Balance |
Interest
|
Rate
|
Average
Balance |
Interest
|
Rate
|
Average
Balance |
Interest
|
Rate
|
||||||||||||||||||
|
|
(Dollars in thousands)
|
||||||||||||||||||||||||||
|
ASSETS
|
|
|
|
|
|
|
|
|
|
|
|
|
|
|
|
|
|
|
|
|
|
|
|
|
|
|
|
|
Taxable loans
|
$
|
1,845,661
|
|
$
|
84,169
|
|
|
4.56
|
%
|
$
|
1,596,136
|
|
$
|
74,014
|
|
|
4.64
|
%
|
$
|
1,457,508
|
|
$
|
70,770
|
|
|
4.86
|
%
|
|
Tax-exempt loans (1)
|
|
3,199
|
|
|
172
|
|
|
5.38
|
|
|
3,763
|
|
|
220
|
|
|
5.85
|
|
|
3,972
|
|
|
246
|
|
|
6.19
|
|
|
Taxable securities
|
|
485,343
|
|
|
10,928
|
|
|
2.25
|
|
|
534,233
|
|
|
9,921
|
|
|
1.86
|
|
|
529,571
|
|
|
7,805
|
|
|
1.47
|
|
|
Tax-exempt securities (1)
|
|
86,902
|
|
|
3,063
|
|
|
3.52
|
|
|
54,390
|
|
|
1,917
|
|
|
3.52
|
|
|
34,039
|
|
|
1,388
|
|
|
4.08
|
|
|
Interest bearing cash
|
|
37,119
|
|
|
264
|
|
|
0.71
|
|
|
78,606
|
|
|
403
|
|
|
0.51
|
|
|
66,595
|
|
|
275
|
|
|
0.41
|
|
|
Other investments
|
|
15,543
|
|
|
836
|
|
|
5.38
|
|
|
15,474
|
|
|
792
|
|
|
5.12
|
|
|
17,171
|
|
|
925
|
|
|
5.39
|
|
|
Interest earning assets
|
|
2,473,767
|
|
|
99,432
|
|
|
4.02
|
|
|
2,282,602
|
|
|
87,267
|
|
|
3.82
|
|
|
2,108,856
|
|
|
81,409
|
|
|
3.86
|
|
|
Cash and due from banks
|
|
31,980
|
|
|
|
|
|
|
|
|
36,831
|
|
|
|
|
|
|
|
|
44,842
|
|
|
|
|
|
|
|
|
Other assets, net
|
|
144,442
|
|
|
|
|
|
|
|
|
155,778
|
|
|
|
|
|
|
|
|
166,363
|
|
|
|
|
|
|
|
|
Total assets
|
$
|
2,650,189
|
|
|
|
|
|
|
|
$
|
2,475,211
|
|
|
|
|
|
|
|
$
|
2,320,061
|
|
|
|
|
|
|
|
|
LIABILITIES
|
|
|
|
|
|
|
|
|
|
|
|
|
|
|
|
|
|
|
|
|
|
|
|
|
|
|
|
|
Savings and interest-bearing checking
|
$
|
1,052,215
|
|
|
1,530
|
|
|
0.15
|
|
$
|
1,018,685
|
|
|
1,115
|
|
|
0.11
|
|
$
|
988,504
|
|
|
1,056
|
|
|
0.11
|
|
|
Time deposits
|
|
502,284
|
|
|
5,245
|
|
|
1.04
|
|
|
447,243
|
|
|
3,826
|
|
|
0.86
|
|
|
386,035
|
|
|
2,953
|
|
|
0.76
|
|
|
Other borrowings
|
|
74,876
|
|
|
2,348
|
|
|
3.14
|
|
|
47,058
|
|
|
1,941
|
|
|
4.12
|
|
|
47,842
|
|
|
1,847
|
|
|
3.86
|
|
|
Interest bearing liabilities
|
|
1,629,375
|
|
|
9,123
|
|
|
0.56
|
|
|
1,512,986
|
|
|
6,882
|
|
|
0.45
|
|
|
1,422,381
|
|
|
5,856
|
|
|
0.41
|
|
|
Non-interest bearing deposits
|
|
728,208
|
|
|
|
|
|
|
|
|
688,697
|
|
|
|
|
|
|
|
|
619,206
|
|
|
|
|
|
|
|
|
Other liabilities
|
|
30,838
|
|
|
|
|
|
|
|
|
26,439
|
|
|
|
|
|
|
|
|
24,840
|
|
|
|
|
|
|
|
|
Shareholders’ equity
|
|
261,768
|
|
|
|
|
|
|
|
|
247,089
|
|
|
|
|
|
|
|
|
253,634
|
|
|
|
|
|
|
|
|
Total liabilities and shareholders’ equity
|
$
|
2,650,189
|
|
|
|
|
|
|
|
$
|
2,475,211
|
|
|
|
|
|
|
|
$
|
2,320,061
|
|
|
|
|
|
|
|
|
Net interest income
|
|
|
|
$
|
90,309
|
|
|
|
|
|
|
|
$
|
80,385
|
|
|
|
|
|
|
|
$
|
75,553
|
|
|
|
|
|
Net interest income as a percent of average interest earning assets
|
|
|
|
|
|
|
|
3.65
|
%
|
|
|
|
|
|
|
|
3.52
|
%
|
|
|
|
|
|
|
|
3.58
|
%
|
| (1) | Interest on tax-exempt loans and securities is presented on a fully tax equivalent basis assuming a marginal tax rate of 35%. |
RECONCILIATION OF NET INTEREST MARGIN, FULLY TAXABLE EQUIVALENT (“FTE”)
|
|
Year Ended December 31,
|
||||||||
|
|
2017
|
2016
|
2015
|
||||||
|
|
(Dollars in thousands)
|
||||||||
|
Net interest income
|
$
|
89,186
|
|
$
|
79,641
|
|
$
|
74,986
|
|
|
Add: taxable equivalent adjustment
|
|
1,123
|
|
|
744
|
|
|
567
|
|
|
Net interest income - taxable equivalent
|
$
|
90,309
|
|
$
|
80,385
|
|
$
|
75,553
|
|
|
Net interest margin (GAAP)
|
|
3.61
|
%
|
|
3.49
|
%
|
|
3.56
|
%
|
|
Net interest margin (FTE)
|
|
3.65
|
%
|
|
3.52
|
%
|
|
3.58
|
%
|
14
CHANGE IN NET INTEREST INCOME
|
|
2017 compared to 2016
|
2016 compared to 2015
|
||||||||||||||||
|
|
Volume
|
Rate
|
Net
|
Volume
|
Rate
|
Net
|
||||||||||||
|
|
(In thousands)
|
|||||||||||||||||
|
Increase (decrease) in interest income (1)
|
|
|
|
|
|
|
|
|
|
|
|
|
|
|
|
|
|
|
|
Taxable loans
|
$
|
11,398
|
|
$
|
(1,243
|
)
|
$
|
10,155
|
|
$
|
6,526
|
|
$
|
(3,282
|
)
|
$
|
3,244
|
|
|
Tax-exempt loans (2)
|
|
(31
|
)
|
|
(17
|
)
|
|
(48
|
)
|
|
(13
|
)
|
|
(13
|
)
|
|
(26
|
)
|
|
Taxable securities
|
|
(966
|
)
|
|
1,973
|
|
|
1,007
|
|
|
69
|
|
|
2,047
|
|
|
2,116
|
|
|
Tax-exempt securities (2)
|
|
1,146
|
|
|
—
|
|
|
1,146
|
|
|
738
|
|
|
(209
|
)
|
|
529
|
|
|
Interest bearing cash
|
|
(260
|
)
|
|
121
|
|
|
(139
|
)
|
|
55
|
|
|
73
|
|
|
128
|
|
|
Other investments
|
|
4
|
|
|
40
|
|
|
44
|
|
|
(88
|
)
|
|
(45
|
)
|
|
(133
|
)
|
|
Total interest income
|
|
11,291
|
|
|
874
|
|
|
12,165
|
|
|
7,287
|
|
|
(1,429
|
)
|
|
5,858
|
|
|
Increase (decrease) in interest expense (1)
|
|
|
|
|
|
|
|
|
|
|
|
|
|
|
|
|
|
|
|
Savings and interest bearing checking
|
|
38
|
|
|
377
|
|
|
415
|
|
|
33
|
|
|
26
|
|
|
59
|
|
|
Time deposits
|
|
508
|
|
|
911
|
|
|
1,419
|
|
|
500
|
|
|
373
|
|
|
873
|
|
|
Other borrowings
|
|
952
|
|
|
(545
|
)
|
|
407
|
|
|
(31
|
)
|
|
125
|
|
|
94
|
|
|
Total interest expense
|
|
1,498
|
|
|
743
|
|
|
2,241
|
|
|
502
|
|
|
524
|
|
|
1,026
|
|
|
Net interest income
|
$
|
9,793
|
|
$
|
131
|
|
$
|
9,924
|
|
$
|
6,785
|
|
$
|
(1,953
|
)
|
$
|
4,832
|
|
| (1) | The change in interest due to changes in both balance and rate has been allocated to change due to balance and change due to rate in proportion to the relationship of the absolute dollar amounts of change in each. |
| (2) | Interest on tax-exempt loans and securities is presented on a fully tax equivalent basis assuming a marginal tax rate of 35%. |
COMPOSITION OF AVERAGE INTEREST EARNING ASSETS AND INTEREST BEARING LIABILITIES
|
|
Year Ended December 31,
|
||||||||
|
|
2017
|
2016
|
2015
|
||||||
|
As a percent of average interest earning assets
|
|
|
|
|
|
|
|
|
|
|
Loans
|
|
74.7
|
%
|
|
70.1
|
%
|
|
69.3
|
%
|
|
Other interest earning assets
|
|
25.3
|
|
|
29.9
|
|
|
30.7
|
|
|
Average interest earning assets
|
|
100.0
|
%
|
|
100.0
|
%
|
|
100.0
|
%
|
|
Savings and NOW
|
|
42.5
|
%
|
|
44.6
|
%
|
|
46.9
|
%
|
|
Time deposits
|
|
18.2
|
|
|
19.6
|
|
|
18.2
|
|
|
Brokered CDs
|
|
2.2
|
|
|
—
|
|
|
0.1
|
|
|
Other borrowings
|
|
3.0
|
|
|
2.1
|
|
|
2.2
|
|
|
Average interest bearing liabilities
|
|
65.9
|
%
|
|
66.3
|
%
|
|
67.4
|
%
|
|
Earning asset ratio
|
|
93.3
|
%
|
|
92.2
|
%
|
|
90.9
|
%
|
|
Free-funds ratio (1)
|
|
34.1
|
|
|
33.7
|
|
|
32.6
|
|
| (1) | Average interest earning assets less average interest bearing liabilities. |
Provision for loan losses. The provision for loan losses was an expense of $1.2 million in 2017 and was a credit of $1.3 million and $2.7 million during 2016 and 2015, respectively. The provision reflects our assessment of the allowance for loan losses taking into consideration factors such as loan mix, levels of non-performing and classified loans and loan net charge-offs. While we use relevant information to recognize losses on loans, additional provisions for related losses may be necessary based on changes in economic conditions, customer circumstances and other credit risk factors. See “Portfolio Loans and asset quality” for a discussion of the various components of the allowance for loan losses and their impact on the provision for loan losses.
15
Non-interest income. Non-interest income is a significant element in assessing our results of operations. Non-interest income totaled $42.5 million during 2017 compared to $42.3 million and $40.1 million during 2016 and 2015, respectively. In May 2014, the Financial Accounting Standards Board (“FASB”) issued Accounting Standards Update (“ASU”) No. 2014-09 “Revenue from Contracts with Customers (Topic 606)” (“ASU 2014-09”). ASU 2014-09 is effective for us on January 1, 2018. Our interest income is excluded from the scope of ASU 2014-09 and for the reasons described in note #1 to our Consolidated Financial Statements, we do not believe that there will be any material impact on our non-interest income. The components of non-interest income are as follows:
NON-INTEREST INCOME
|
|
Year Ended December 31,
|
||||||||
|
|
2017
|
2016
|
2015
|
||||||
|
|
(In thousands)
|
||||||||
|
Service charges on deposit accounts
|
$
|
12,673
|
|
$
|
12,406
|
|
$
|
12,389
|
|
|
Interchange income
|
|
8,023
|
|
|
7,938
|
|
|
8,481
|
|
|
Net gains on assets
|
|
|
|
|
|
|
|
|
|
|
Mortgage loans
|
|
11,762
|
|
|
10,566
|
|
|
7,448
|
|
|
Securities
|
|
260
|
|
|
563
|
|
|
20
|
|
|
Mortgage loan servicing, net
|
|
1,647
|
|
|
2,222
|
|
|
1,751
|
|
|
Investment and insurance commissions
|
|
1,968
|
|
|
1,647
|
|
|
1,827
|
|
|
Bank owned life insurance
|
|
1,061
|
|
|
1,124
|
|
|
1,282
|
|
|
Net gain on branch sale
|
|
—
|
|
|
—
|
|
|
1,193
|
|
|
Other
|
|
5,139
|
|
|
5,832
|
|
|
5,739
|
|
|
Total non-interest income
|
$
|
42,533
|
|
$
|
42,298
|
|
$
|
40,130
|
|
Service charges on deposit accounts totaled $12.7 million in 2017 as compared to $12.4 million during both 2016 and 2015. The 2017 increase was principally due to higher service charges on commercial accounts and a modest increase in non-sufficient funds occurrences.
Interchange income totaled $8.0 million in 2017 compared to $7.9 million in 2016 and $8.5 million in 2015. The increase in interchange income in 2017 as compared to 2016 is primarily due to increased transaction volume. The decrease in interchange income in 2016 as compared to 2015 was primarily due to lower incentives under our Debit Brand Agreement with MasterCard. In addition, although transaction volume increased 1.5% in 2016 as compared to 2015, interchange revenue per transaction declined by 3.1%, primarily due to a higher mix of debit (PIN-based) versus credit (signature-based) transactions.
We realized net gains of $11.8 million on mortgage loans during 2017, compared to $10.6 million and $7.4 million during 2016 and 2015 respectively. Mortgage loan activity is summarized as follows:
MORTGAGE LOAN ACTIVITY
|
|
Year Ended December 31,
|
||||||||
|
|
2017
|
2016
|
2015
|
||||||
|
|
(Dollars in thousands)
|
||||||||
|
Mortgage loans originated
|
$
|
871,222
|
|
$
|
428,249
|
|
$
|
336,618
|
|
|
Mortgage loans sold
|
|
423,327
|
|
|
313,985
|
|
|
281,494
|
|
|
Net gains on mortgage loans
|
|
11,762
|
|
|
10,566
|
|
|
7,448
|
|
|
Net gains as a percent of mortgage loans sold (“Loan Sales Margin”)
|
|
2.78
|
%
|
|
3.37
|
%
|
|
2.65
|
%
|
|
Fair value adjustments included in the Loan Sales Margin
|
|
(0.07
|
)
|
|
0.12
|
|
|
0.16
|
|
The increase in mortgage loan originations, sales and net gains in 2017 and 2016 as compared to 2015 is due primarily to the expansion of our mortgage-banking operations. In addition, an improving housing market has resulted in an increase in purchase money mortgage origination volume.
During the last quarter of 2016 and the first half of 2017, we significantly expanded our mortgage-banking operations by adding new employees and opening new loan production offices (Ann Arbor, Brighton, Dearborn, Grosse Pointe, Traverse City and Troy, Michigan and Columbus and Fairlawn, Ohio). Overall, we have increased
16
average full-time equivalent employees in mortgage lending sales and operations by 58.4% in 2017 as compared to 2016. This business expansion has increased net gains on mortgage loans and has accelerated the growth of portfolio mortgage loans and mortgage loans serviced for others, leading to increased mortgage loan interest income and mortgage loan servicing revenue. However, this expansion has also increased non-interest expenses, particularly compensation and employee benefits and occupancy. In addition, due to higher interest rates, mortgage loan refinance volume has declined in 2017 on an industry-wide basis. It is important to our future results of operations that we effectively and successfully manage this business expansion.
The volume of loans sold is dependent upon our ability to originate mortgage loans as well as the demand for fixed-rate obligations and other loans that we choose to not put into portfolio because of our established interest-rate risk parameters. (See “Portfolio Loans and asset quality.”) Net gains on mortgage loans are also dependent upon economic and competitive factors as well as our ability to effectively manage exposure to changes in interest rates and thus can often be a volatile part of our overall revenues.
Net gains as a percentage of mortgage loans sold (our “Loan Sales Margin”) are impacted by several factors including competition and the manner in which the loan is sold. Net gains on mortgage loans are also impacted by recording fair value accounting adjustments. Excluding these fair value accounting adjustments, the Loan Sales Margin would have been 2.85% in 2017, 3.25% in 2016 and 2.49% in 2015. The higher Loan Sales Margin in 2016 as compared to 2017 and 2015, was principally due to more favorable competitive conditions including wider primary-to-secondary market pricing spreads for much of that year. In 2017, our Loan Sales Margin contracted due to competitive factors. In general, as overall industry-wide mortgage loan origination levels drop, pricing becomes more competitive. The changes in the fair value accounting adjustments are primarily due to changes in the amount of commitments to originate mortgage loans for sale during each period.
We generated net gains on securities of $0.3 million, $0.6 million and $0.02 million in 2017, 2016 and 2015, respectively. The 2017 net gain was due primarily to a $0.045 million increase in the fair value of trading securities and $17.3 million of securities sales that produced net gains of $0.215 million. The 2016 net gain was due primarily to a $0.3 million increase in the fair value of trading securities and $64.1 million of securities sales that produced net gains of $0.3 million. The 2015 net gain was due primarily to the sales of U.S. agency residential mortgage-backed securities that were partially offset by a $0.06 million decline in the fair value of trading securities. We recorded no net impairment losses in 2017, 2016 or 2015 for other than temporary impairment of securities available for sale.
GAINS AND LOSSES ON SECURITIES
|
|
Year Ended December 31,
|
|||||||||||
|
|
Proceeds
|
Gains (1)
|
Losses (2)
|
Net
|
||||||||
|
|
(In thousands)
|
|||||||||||
|
2017
|
$
|
17,308
|
|
$
|
263
|
|
$
|
3
|
|
$
|
260
|
|
|
2016
|
|
64,103
|
|
|
616
|
|
|
53
|
|
|
563
|
|
|
2015
|
|
12,037
|
|
|
75
|
|
|
55
|
|
|
20
|
|
| (1) | Gains in 2017 and 2016 include $0.045 million and $0.262 million, respectively related to an increase in the fair value of trading securities. |
| (2) | Losses in 2015 include $0.055 million related to a decrease in the fair value of trading securities. |
17
Mortgage loan servicing generated net earnings of $1.6 million, $2.2 million and $1.8 million in 2017, 2016 and 2015, respectively. This activity is summarized in the following table:
MORTGAGE LOAN SERVICING ACTIVITY
|
|
2017
|
2016
|
2015
|
||||||
|
|
(In thousands)
|
||||||||
|
Mortgage loan servicing:
|
|
|
|
|
|
|
|
|
|
|
Revenue, net
|
$
|
4,391
|
|
$
|
4,106
|
|
$
|
4,118
|
|
|
Fair value change due to price
|
|
(718
|
)
|
|
—
|
|
|
—
|
|
|
Fair value change due to pay-downs
|
|
(2,026
|
)
|
|
—
|
|
|
—
|
|
|
Amortization
|
|
—
|
|
|
(2,850
|
)
|
|
(2,868
|
)
|
|
Impairment (charge) recovery
|
|
—
|
|
|
966
|
|
|
501
|
|
|
Total
|
$
|
1,647
|
|
$
|
2,222
|
|
$
|
1,751
|
|
Effective on January 1, 2017, we adopted the fair value accounting method for capitalized mortgage loan servicing rights. Activity related to capitalized mortgage loan servicing rights is as follows:
CAPITALIZED MORTGAGE LOAN SERVICING RIGHTS
|
|
2017
|
2016
|
2015
|
||||||
|
|
(In thousands)
|
||||||||
|
Balance at January 1,
|
$
|
13,671
|
|
$
|
12,436
|
|
$
|
12,106
|
|
|
Change in accounting
|
|
542
|
|
|
—
|
|
|
—
|
|
|
Balance at January 1, as adjusted
|
|
14,213
|
|
|
12,436
|
|
|
12,106
|
|
|
Originated servicing rights capitalized
|
|
4,230
|
|
|
3,119
|
|
|
2,697
|
|
|
Amortization
|
|
—
|
|
|
(2,850
|
)
|
|
(2,868
|
)
|
|
Change in valuation allowance
|
|
—
|
|
|
966
|
|
|
501
|
|
|
Change in fair value
|
|
(2,744
|
)
|
|
—
|
|
|
—
|
|
|
Balance at December 31,
|
$
|
15,699
|
|
$
|
13,671
|
|
$
|
12,436
|
|
|
Valuation allowance at December 31,
|
$
|
—
|
|
$
|
2,306
|
|
$
|
3,272
|
|
At December 31, 2017, we were servicing approximately $1.82 billion in mortgage loans for others on which servicing rights have been capitalized. This servicing portfolio had a weighted average coupon rate of 4.17% and a weighted average service fee of approximately 25.8 basis points. Remaining capitalized mortgage loan servicing rights at December 31, 2017 totaled $15.7 million, representing approximately 86 basis points on the related amount of mortgage loans serviced for others.
Investment and insurance commissions totaled $2.0 million in 2017, as compared to $1.6 million and $1.8 million in 2016 and 2015, respectively. The increase in 2017 as compared to 2016 was due primarily to growth in sales and assets under management. The decline in 2016 as compared to 2015 was due primarily to open sales positions during part of that year.
We earned $1.1 million, $1.1 million and $1.3 million in 2017, 2016 and 2015, respectively, on our separate account bank owned life insurance principally as a result of increases in the cash surrender value. Our separate account is primarily invested in agency mortgage-backed securities and managed by PIMCO. The crediting rate (on which the earnings are based) reflects the performance of the separate account. The total cash surrender value of our bank owned life insurance was $54.6 million and $54.0 million at December 31, 2017 and 2016, respectively.
On April 29, 2015 the Bank entered into a Purchase and Assumption Agreement (“PAA”) with Isabella Bank (based in Mt. Pleasant, Michigan). Pursuant to the PAA, on August 28, 2015, we sold the fixed assets, real property and certain other assets of our bank branch located in Midland, Michigan (the “Midland Branch”) to Isabella Bank. The deposit liabilities of the Midland Branch were assumed by Isabella Bank. Under the terms of the PAA, Isabella Bank paid a premium of $0.6 million (which was equal to 6.0% of the average deposit liabilities of $9.7 million based on the 20-day average ending two business days prior to the closing date of August 28, 2015) and $0.85 million for
18
the real property and fixed assets (including the ATM). The real property and the fixed assets had a net book value of approximately $0.2 million as of August 28, 2015. We recorded a net gain of $1.2 million in the third quarter of 2015 on the sale of the Midland Branch.
Other non-interest income totaled $5.1 million, $5.8 million and $5.7 million in 2017, 2016 and 2015, respectively. The decrease in 2017 as compared to 2016 and 2015 is primarily due to a reduction in title insurance fees and lower rental income on other real estate.
Non-interest expense. Non-interest expense is an important component of our results of operations. We strive to efficiently manage our cost structure.
Non-interest expense totaled $92.1 million in 2017, $90.3 million in 2016, and $88.5 million in 2015. The components of non-interest expense are as follows:
NON-INTEREST EXPENSE
|
|
Year ended December 31,
|
||||||||
|
|
2017
|
2016
|
2015
|
||||||
|
|
(In thousands)
|
||||||||
|
Compensation
|
$
|
35,397
|
|
$
|
33,080
|
|
$
|
32,677
|
|
|
Performance-based compensation
|
|
9,874
|
|
|
7,866
|
|
|
7,401
|
|
|
Payroll taxes and employee benefits
|
|
9,818
|
|
|
8,633
|
|
|
8,108
|
|
|
Compensation and employee benefits
|
|
55,089
|
|
|
49,579
|
|
|
48,186
|
|
|
Occupancy, net
|
|
8,102
|
|
|
8,023
|
|
|
8,369
|
|
|
Data processing
|
|
7,657
|
|
|
7,952
|
|
|
7,944
|
|
|
Furniture, fixtures and equipment
|
|
3,870
|
|
|
3,912
|
|
|
3,892
|
|
|
Communications
|
|
2,684
|
|
|
3,142
|
|
|
2,957
|
|
|
Loan and collection
|
|
2,230
|
|
|
2,512
|
|
|
3,609
|
|
|
Advertising
|
|
1,905
|
|
|
1,856
|
|
|
2,121
|
|
|
Legal and professional
|
|
1,892
|
|
|
1,742
|
|
|
2,013
|
|
|
Interchange expense
|
|
1,156
|
|
|
1,111
|
|
|
1,125
|
|
|
FDIC deposit insurance
|
|
894
|
|
|
1,049
|
|
|
1,366
|
|
|
Supplies
|
|
666
|
|
|
728
|
|
|
809
|
|
|
Credit card and bank service fees
|
|
529
|
|
|
791
|
|
|
797
|
|
|
Costs (recoveries) related to unfunded lending commitments
|
|
475
|
|
|
(2
|
)
|
|
113
|
|
|
Amortization of intangible assets
|
|
346
|
|
|
347
|
|
|
347
|
|
|
Merger related expenses
|
|
284
|
|
|
—
|
|
|
—
|
|
|
Provision (credit) for loss reimbursement on sold loans
|
|
171
|
|
|
30
|
|
|
(59
|
)
|
|
Net (gains) losses on other real estate and repossessed assets
|
|
(606
|
)
|
|
250
|
|
|
(180
|
)
|
|
Litigation settlement expense
|
|
—
|
|
|
2,300
|
|
|
—
|
|
|
Loss on sale of payment plan business
|
|
—
|
|
|
320
|
|
|
—
|
|
|
Other
|
|
4,738
|
|
|
4,705
|
|
|
5,041
|
|
|
Total non-interest expense
|
$
|
92,082
|
|
$
|
90,347
|
|
$
|
88,450
|
|
Compensation expense, which is primarily salaries, totaled $35.4 million, $33.1 million and $32.7 million in 2017, 2016 and 2015, respectively. The increase in 2017 as compared to 2016 is primarily due to annual merit based salary increases and a 6.8% rise in average total full-time equivalent employees due principally to the aforementioned expansion of our mortgage banking operations. The increase in 2016 as compared to 2015 is primarily due to annual merit based salary increases. 2016 average total full-time equivalent employee levels were unchanged compared to 2015.
Performance-based compensation expense totaled $9.9 million, $7.9 million and $7.4 million in 2017, 2016 and 2015, respectively. The increases in 2017 as compared to 2016, and in 2016 as compared to 2015, are both primarily related to higher compensation under our Management Incentive Compensation Plan (“MICP”) based on our performance relative to plan targets and increased mortgage loan officer retention bonuses. In computing MICP results in 2017, our Board of Directors determined that it was appropriate to exclude the impact of the $6.0 million
19
of additional income tax expense related to the remeasurement of our DTA as described earlier under “Recent Developments”, consistent with the prior practice of excluding unique, one-time, adjustments to our reported financial results.
We maintain performance-based compensation plans. In addition to commissions and cash incentive awards, such plans include an employee stock ownership plan (ESOP) and a long-term equity based incentive plan. The amount of expense recognized in 2017, 2016 and 2015 for share-based awards under our long-term equity based incentive plan was $1.6 million, $1.5 million and $1.4 million, respectively. In 2017, 2016 and 2015, the Board and Compensation Committee of the Board authorized the grant of restricted stock and performance share awards under the plan.
Payroll taxes and employee benefits expense totaled $9.8 million, $8.6 million and $8.1 million in 2017, 2016 and 2015, respectively. The increase in 2017 as compared to 2016 is primarily due to a $0.6 million increase in payroll taxes, a $0.4 million increase in health care insurance and a $0.2 million increase in recruiting costs. The increase in 2016 as compared to 2015 is primarily due to a $0.2 million increase in our 401(k) plan match and a $0.2 million increase in employee training costs (primarily sales training). In 2015, we added auto-enrollment to our 401(k) plan. In 2016, we increased our 401(k) plan match from 2% to 3% of eligible compensation.
Occupancy expenses, net, totaled $8.1 million, $8.0 million and $8.4 million in 2017, 2016 and 2015, respectively. The increase in 2017 as compared to 2016 is primarily due to increased lease costs for new loan production offices related to the aforementioned expansion of our mortgage banking operations. The decrease in 2016 as compared to 2015 is primarily due to a decline in utilities and real estate property taxes due to branch closings or sales that took place during 2015 as well as a decline in leasehold improvement depreciation expense at Mepco related to its former Chicago location.
Data processing expenses totaled $7.7 million, $8.0 million, and $7.9 million in 2017, 2016 and 2015, respectively. The decrease in 2017 as compared to 2016 is primarily due to a $0.8 million decline related to the sale of our payment processing business in May 2017 that was partially offset by a $0.5 million increase related to higher mobile banking activity and software costs for new or expanded lending systems. Although data processing expenses were relatively unchanged in 2016 as compared to 2015 on a consolidated basis, such expenses declined by $0.6 million at Mepco (due primarily to a decrease in software amortization); however, this decline was offset by a comparable increase in such expenses at the Bank (various new or expanded electronic banking services and network security costs).
Furniture, fixtures and equipment expense was relatively unchanged during 2017, 2016 and 2015.
Communications expense decreased by $0.5 million in 2017 as compared to 2016 and increased by $0.2 million in 2016 as compared to 2015. The decrease in 2017 as compared to 2016 is primarily due to the sale of our payment plan processing business in May 2017, reduced checking account related direct mail and a change in our telecommunications provider as well as 2016 including a debit card mailing. The increase in 2016 as compared to 2015 was due primarily to an increase in postage costs principally as a result of mailing new chip-enabled debit cards to our entire debit card customer base.
Loan and collection expenses primarily reflect costs related to the management and collection of non-performing loans and other problem credits. These expenses have declined steadily during the past several years primarily due to decreases in non-performing loans, new loan defaults and watch/problem credits as well as recoveries of previously incurred collection costs.
Advertising expense totaled $1.9 million, $1.9 million, and $2.1 million in 2017, 2016 and 2015, respectively. The decrease in 2017 and 2016 as compared to 2015 was primarily due to declines in outdoor (billboard) advertising, television and radio advertising and market research that were partially offset by an increase in checking account acquisition costs (principally direct mail).
Legal and professional fees totaled $1.9 million, $1.7 million, and $2.0 million in 2017, 2016 and 2015, respectively. The increase in 2017 as compared to 2016 is primarily due to higher co-sourced internal audit costs and higher consulting costs for certain deposit account programs. The decrease in 2016 as compared to 2015 was due primarily to a $0.4 million decline in such costs at Mepco resulting from the resolution of certain litigation matters and a related reduction in legal fees.
20
Interchange expense primarily represents fees paid to our core information systems processor and debit card licensor related to debit card and ATM transactions. This expense was relatively unchanged during 2017, 2016 and 2015.
FDIC deposit insurance expense totaled $0.9 million, $1.0 million, and $1.4 million in 2017, 2016 and 2015, respectively. The declines in 2017 and 2016 as compared to 2015 principally results from the FDIC Deposit Insurance Fund reserve ratio reaching a 1.15% reserve ratio at June 30, 2016, which triggered a new assessment method and generally lower deposit insurance premiums for banks with less than $10 billion in assets.
Supplies expense has declined over the past two years consistent with our cost reduction efforts including “go-green” initiatives to reduce paper usage and printing.
Credit card and bank service fees primarily relate to card processing fees incurred by Mepco in its payment plan processing business. This business was sold in May 2017. (See “Recent Developments.”)
The changes in costs (recoveries) related to unfunded lending commitments are primarily impacted by changes in the amounts of such commitments to originate Portfolio Loans as well as (for commercial loan commitments) the grade (pursuant to our loan rating system) of such commitments.
The amortization of intangible assets primarily relates to branch acquisitions and the amortization of the deposit customer relationship value, including core deposit value, which was acquired in connection with those acquisitions. We had remaining unamortized intangible assets of $1.6 million and $1.9 million at December 31, 2017 and 2016 respectively. See note #7 to the Consolidated Financial Statements for a schedule of future amortization of intangible assets.
Merger related expenses in 2017 primarily represent legal and investment banking fees incurred with respect to our pending acquisition of TCSB. (See “Recent Developments.”)
The provision for loss reimbursement on sold loans was an expense of $0.17 million and $0.03 million in 2017 and 2016, respectively, compared to a credit of $0.06 million in 2015. This provision represents our estimate of incurred losses related to mortgage loans that we have sold to investors (primarily Fannie Mae, Freddie Mac, Ginnie Mae and the Federal Home Loan Bank of Indianapolis). Since we sell mortgage loans without recourse, loss reimbursements only occur in those instances where we have breached a representation or warranty or other contractual requirement related to the loan sale. The reserve for loss reimbursements on sold mortgage loans totaled $0.67 million and $0.56 million at December 31, 2017 and 2016, respectively. This reserve is included in accrued expenses and other liabilities in our Consolidated Statements of Financial Condition. We believe that the amounts that we have accrued for incurred losses on sold mortgage loans are appropriate based upon our prior experience and other assumptions. However, future losses could exceed our current estimate.
Net (gains) losses on other real estate and repossessed assets represent the gain or loss on the sale or additional write downs on these assets subsequent to the transfer of the asset from our loan portfolio. This transfer occurs at the time we acquire the collateral that secured the loan. At the time of acquisition, the other real estate or repossessed asset is valued at fair value, less estimated costs to sell, which becomes the new basis for the asset. Any write-downs at the time of acquisition are charged to the allowance for loan losses. The net gain of $0.6 million in 2017 was primarily due to the sale of a commercial property in the fourth quarter of that year. The net loss of $0.25 million in 2016 was primarily due to $0.46 million of write-downs on a group of commercial income-producing properties that were subsequently sold in 2017. The net gain of $0.2 million in 2015 primarily reflected stable to improving real estate prices.
We incurred a $2.3 million expense in 2016 for the settlement of a litigation matter as described earlier under “Recent Developments.”
We incurred a $0.3 million loss in 2016 on the expected sale of Mepco’s payment plan business as described earlier under “Recent Developments.”
Other non-interest expenses totaled $4.7 million, $4.7 million, and $5.0 million in 2017, 2016 and 2015, respectively. The $0.3 million decrease in 2017 and 2016 as compared to 2015 is primarily due to declines in corporate insurance costs, vehicle service contract counterparty contingency expense and fraud costs related to deposit account and debit card activities.
21
Income tax expense. We recorded an income tax expense of $18.0 million, $10.1 million and $9.4 million in 2017, 2016 and 2015, respectively. 2017 includes an additional $6.0 million of income tax expense related to the remeasurement of our DTA as described earlier under “Recent Developments.”
Our actual federal income tax expense is different than the amount computed by applying our statutory federal income tax rate to our pre-tax income primarily due to tax-exempt interest income and tax-exempt income from the increase in the cash surrender value on life insurance (and for 2017, the remeasurement of our DTA as well). As a result of the reduced federal corporate income tax rate effective January 1, 2018, we expect our actual federal income tax to be approximately 19% to 20% of our income before income tax.
In addition, 2016 included a $0.3 million income tax benefit resulting from the adoption of FASB ASU 2016-09 “Compensation – Stock Compensation (718) Improvements to Employee Share-Based Payment Accounting.”
We assess whether a valuation allowance should be established against our DTA based on the consideration of all available evidence using a “more likely than not” standard. The ultimate realization of this asset is primarily based on generating future income. We concluded at December 31, 2017 and 2016 that the realization of substantially all of our DTA continues to be more likely than not.
We had maintained a valuation allowance against our DTA of approximately $1.1 million at December 31, 2016. This valuation allowance on our DTA related to state income taxes at Mepco. In this instance, we determined that the future realization of this particular DTA was not more likely than not. That conclusion was based on the pending sale of Mepco’s payment plan business. After accounting for the May 2017 sale of our payment plan business, all that remained of this DTA was loss carryforwards that we wrote off against the related valuation allowance as of June 30, 2017 as we will no longer be doing business in those states.
22
FINANCIAL CONDITION
Summary. Our total assets increased to $2.79 billion at December 31, 2017, compared to $2.55 billion at December 31, 2016, primarily due to an increase loans. Loans, excluding loans held for sale (“Portfolio Loans”), totaled $2.02 billion at December 31, 2017, an increase of 25.5% from $1.61 billion at December 31, 2016. (See “Portfolio Loans and asset quality”). The increase in Portfolio Loans during the last few years is part of our overall strategy to grow revenues, earnings and improve our operating leverage by increasing our loans to deposits ratio. The expansion of our mortgage banking operations, as described earlier, is part of this strategy along with continuing to increase our commercial and consumer installment lending.
Deposits totaled $2.40 billion at December 31, 2017, compared to $2.23 billion at December 31, 2016. The $174.8 million increase in total deposits during the period reflects growth in all categories, except time deposits, which declined by $79.0 million. The decline in time deposits primarily reflects maturities with one municipal customer, where we elected to allow the deposits to run-off rather than rebidding for these funds.
Securities. We maintain diversified securities portfolios, which include obligations of U.S. government-sponsored agencies, securities issued by states and political subdivisions, residential and commercial mortgage-backed securities, asset-backed securities, corporate securities, trust preferred securities and foreign government securities (that are denominated in U.S. dollars). We regularly evaluate asset/liability management needs and attempt to maintain a portfolio structure that provides sufficient liquidity and cash flow. Except as discussed below, we believe that the unrealized losses on securities available for sale are temporary in nature and are expected to be recovered within a reasonable time period. We believe that we have the ability to hold securities with unrealized losses to maturity or until such time as the unrealized losses reverse. (See “Asset/liability management.”) Securities available for sale declined by $87.7 million during 2017 as these funds were utilized to support net Portfolio Loan growth.
We adopted FASB ASU 2017-08, “Receivables-Nonrefundable Fees and Other Costs (Subtopic 310-20) Premium Amortization on Purchased Callable Debt Securities” during the first quarter of 2017 using a modified retrospective approach. As a result, the amortized cost of securities as of January 1, 2017 was adjusted lower by $0.46 million (see note #1 to the Consolidated Financial Statements).
Our portfolio of securities available for sale is reviewed quarterly for impairment in value. In performing this review, management considers (1) the length of time and extent that fair value has been less than cost, (2) the financial condition and near term prospects of the issuer, (3) the impact of changes in market interest rates on the market value of the security and (4) an assessment of whether we intend to sell, or it is more likely than not that we will be required to sell, a security in an unrealized loss position before recovery of its amortized cost basis. For securities that do not meet these recovery criteria, the amount of impairment recognized in earnings is limited to the amount related to credit losses, while impairment related to other factors is recognized in other comprehensive income. We recorded no net impairment losses related to other than temporary impairment on securities available for sale in 2017, 2016 or 2015.
SECURITIES
|
|
Amortized
Cost |
Unrealized
|
Fair
Value |
|||||||||
|
|
Gains
|
Losses
|
||||||||||
|
|
(In thousands)
|
|||||||||||
|
Securities available for sale
|
|
|
|
|
|
|
|
|
|
|
|
|
|
December 31, 2017
|
$
|
523,520
|
|
$
|
3,197
|
|
$
|
3,792
|
|
$
|
522,925
|
|
|
December 31, 2016
|
|
615,709
|
|
|
2,548
|
|
|
7,641
|
|
|
610,616
|
|
Portfolio Loans and asset quality. In addition to the communities served by our Bank branch and loan production office network, our principal lending markets also include nearby communities and metropolitan areas. Subject to established underwriting criteria, we also may participate in commercial lending transactions with certain non-affiliated banks and make whole loan purchases from other financial institutions.
The senior management and board of directors of our Bank retain authority and responsibility for credit decisions and we have adopted uniform underwriting standards. Our loan committee structure and the loan review process attempt to provide requisite controls and promote compliance with such established underwriting standards. However, there can be no assurance that our lending procedures and the use of uniform underwriting standards will prevent us from incurring significant credit losses in our lending activities.
23
We generally retain loans that may be profitably funded within established risk parameters. (See “Asset/liability management.”) As a result, we may hold adjustable-rate conventional and fixed rate jumbo mortgage loans as Portfolio Loans, while 15- and 30-year fixed-rate non-jumbo mortgage loans are generally sold to mitigate exposure to changes in interest rates. (See “Non-interest income.”) Due primarily to the expansion of our mortgage-banking activities and a change in mix in our mortgage loan originations, we are now originating and putting into Portfolio Loans more fixed rate mortgage loans compared to past periods. These fixed rate mortgage loans generally have terms from 15 to 30 years, do not have prepayment penalties and expose us to more interest rate risk. To date, our interest rate risk profile has not changed significantly. However, we are carefully monitoring this change in the composition of our Portfolio Loans and the impact of potential future changes in interest rates on our changes in market value of portfolio equity and changes in net interest income. (See “Asset/liability management.”). As a result, we have added and may continue to add some longer-term borrowings, may utilize derivatives (interest rate swaps and interest rate caps) to manage interest rate risk and may begin to attempt to sell fixed rate jumbo mortgage loans in the future.
LOAN PORTFOLIO COMPOSITION
|
|
December 31,
|
|||||
|
|
2017
|
2016
|
||||
|
|
(In thousands)
|
|||||
|
Real estate (1)
|
|
|
|
|
|
|
|
Residential first mortgages
|
$
|
672,592
|
|
$
|
453,348
|
|
|
Residential home equity and other junior mortgages
|
|
136,560
|
|
|
105,550
|
|
|
Construction and land development
|
|
143,188
|
|
|
77,287
|
|
|
Other (2)
|
|
538,880
|
|
|
525,748
|
|
|
Consumer
|
|
291,091
|
|
|
234,632
|
|
|
Commercial
|
|
231,786
|
|
|
206,607
|
|
|
Agricultural
|
|
4,720
|
|
|
5,076
|
|
|
Total loans
|
$
|
2,018,817
|
|
$
|
1,608,248
|
|
| (1) | Includes both residential and non-residential commercial loans secured by real estate. |
| (2) | Includes loans secured by multi-family residential and non-farm, non-residential property. |
NON-PERFORMING ASSETS (1)
|
|
December 31,
|
||||||||
|
|
2017
|
2016
|
2015
|
||||||
|
|
(Dollars in thousands)
|
||||||||
|
Non-accrual loans
|
$
|
8,184
|
|
$
|
13,364
|
|
$
|
10,607
|
|
|
Loans 90 days or more past due and still accruing interest
|
|
—
|
|
|
—
|
|
|
116
|
|
|
Total non-performing loans
|
|
8,184
|
|
|
13,364
|
|
|
10,723
|
|
|
Other real estate and repossessed assets
|
|
1,643
|
|
|
5,004
|
|
|
7,150
|
|
|
Total non-performing assets
|
$
|
9,827
|
|
$
|
18,368
|
|
$
|
17,873
|
|
|
|
|
|
|
|
|
|
|
|
|
|
As a percent of Portfolio Loans
|
|
|
|
|
|
|
|
|
|
|
Non-performing loans
|
|
0.41
|
%
|
|
0.83
|
%
|
|
0.71
|
%
|
|
Allowance for loan losses
|
|
1.12
|
|
|
1.26
|
|
|
1.49
|
|
|
Non-performing assets to total assets
|
|
0.35
|
|
|
0.72
|
|
|
0.74
|
|
|
Allowance for loan losses as a percent of non-performing loans
|
|
275.99
|
|
|
151.41
|
|
|
210.48
|
|
| (1) | Excludes loans classified as “troubled debt restructured” that are performing and vehicle service contract counterparty receivables, net. |
24
TROUBLED DEBT RESTRUCTURINGS
|
|
December 31, 2017
|
||||||||
|
|
Commercial
|
Retail (1)
|
Total
|
||||||
|
|
(In thousands)
|
||||||||
|
Performing TDR's
|
$
|
7,748
|
|
$
|
52,367
|
|
$
|
60,115
|
|
|
Non-performing TDR's (2)
|
|
323
|
|
|
4,506
|
(3)
|
|
4,829
|
|
|
Total
|
$
|
8,071
|
|
$
|
56,873
|
|
$
|
64,944
|
|
|
|
December 31, 2016
|
||||||||
|
|
Commercial
|
Retail (1)
|
Total
|
||||||
|
|
(In thousands)
|
||||||||
|
Performing TDR's
|
$
|
10,560
|
|
$
|
59,726
|
|
$
|
70,286
|
|
|
Non-performing TDR's (2)
|
|
3,565
|
|
|
4,071
|
(3)
|
|
7,636
|
|
|
Total
|
$
|
14,125
|
|
$
|
63,797
|
|
$
|
77,922
|
|
| (1) | Retail loans include mortgage and installment loan segments. |
| (2) | Included in non-performing loans table above. |
| (3) | Also includes loans on non-accrual at the time of modification until six payments are received on a timely basis. |
Non-performing loans totaled $8.2 million, $13.4 million and $10.7 million at December 31, 2017, 2016 and 2015, respectively. The decline in 2017 as compared to 2016 primarily reflects the pay-off or liquidation of non-performing commercial loans. The increase in 2016 as compared to 2015 is primarily due to the default of one commercial loan relationship and one mortgage loan relationship in the fourth quarter of 2016. In general, stable economic conditions in our market areas, as well as our collection and resolution efforts, have resulted in relatively low levels non-performing loans the last few years. However, we are still experiencing some loan defaults, particularly related to commercial loans secured by income-producing property and mortgage loans secured by resort/vacation property.
Non-performing loans exclude performing loans that are classified as troubled debt restructurings (“TDRs”). Performing TDRs totaled $60.1 million, or 3.0% of total Portfolio Loans, and $70.3 million, or 4.4% of total Portfolio Loans, at December 31, 2017 and 2016, respectively. The decrease in the amount of performing TDRs during 2017 reflects declines in both commercial loan and mortgage loan TDRs due primarily to payoffs and amortization.
ORE and repossessed assets totaled $1.6 million at December 31, 2017, compared to $5.0 million at December 31, 2016. The decrease in ORE during 2017 primarily reflects the sale of properties during the year being in excess of the inward migration of new properties.
We will place a loan that is 90 days or more past due on non-accrual, unless we believe the loan is both well secured and in the process of collection. Accordingly, we have determined that the collection of the accrued and unpaid interest on any loans that are 90 days or more past due and still accruing interest is probable.
ALLOCATION OF THE ALLOWANCE FOR LOAN LOSSES
|
|
December 31,
|
||||||||
|
|
2017
|
2016
|
2015
|
||||||
|
|
(In thousands)
|
||||||||
|
Specific allocations
|
$
|
6,839
|
|
$
|
9,152
|
|
$
|
10,983
|
|
|
Other adversely rated commercial loans
|
|
1,228
|
|
|
491
|
|
|
1,053
|
|
|
Historical loss allocations
|
|
7,125
|
|
|
4,929
|
|
|
5,262
|
|
|
Additional allocations based on subjective factors
|
|
7,395
|
|
|
5,662
|
|
|
5,272
|
|
|
Total
|
$
|
22,587
|
|
$
|
20,234
|
|
$
|
22,570
|
|
Some loans will not be repaid in full. Therefore, an allowance for loan losses (“AFLL”) is maintained at a level which represents our best estimate of losses incurred. In determining the AFLL and the related provision for loan
25
losses, we consider four principal elements: (i) specific allocations based upon probable losses identified during the review of the loan portfolio, (ii) allocations established for other adversely rated commercial loans, (iii) allocations based principally on historical loan loss experience, and (iv) additional allowances based on subjective factors, including local and general economic business factors and trends, portfolio concentrations and changes in the size and/or the general terms of the loan portfolios.
The first AFLL element (specific allocations) reflects our estimate of probable incurred losses based upon our systematic review of specific loans. These estimates are based upon a number of factors, such as payment history, financial condition of the borrower, discounted collateral exposure and discounted cash flow analysis. Impaired commercial, mortgage and installment loans are allocated AFLL amounts using this first element. The second AFLL element (other adversely rated commercial loans) reflects the application of our commercial loan rating system. This rating system is similar to those employed by state and federal banking regulators. Commercial loans that are rated below a certain predetermined classification are assigned a loss allocation factor for each loan classification category that is based upon a historical analysis of both the probability of default and the expected loss rate (“loss given default”). The lower the rating assigned to a loan or category, the greater the allocation percentage that is applied. The third AFLL element (historical loss allocations) is determined by assigning allocations to higher rated (“non-watch credit”) commercial loans using a probability of default and loss given default similar to the second AFLL element and to homogenous mortgage and installment loan groups based upon borrower credit score and portfolio segment. For homogenous mortgage and installment loans a probability of default for each homogenous pool is calculated by way of credit score migration. Historical loss data for each homogenous pool coupled with the associated probability of default is utilized to calculate an expected loss allocation rate. The fourth AFLL element (additional allocations based on subjective factors) is based on factors that cannot be associated with a specific credit or loan category and reflects our attempt to ensure that the overall AFLL appropriately reflects a margin for the imprecision necessarily inherent in the estimates of expected credit losses. We consider a number of subjective factors when determining this fourth element, including local and general economic business factors and trends, portfolio concentrations and changes in the size, mix and the general terms of the overall loan portfolio.
Increases in the AFLL are recorded by a provision for loan losses charged to expense. Although we periodically allocate portions of the AFLL to specific loans and loan portfolios, the entire AFLL is available for incurred losses. We generally charge-off commercial, homogenous residential mortgage and installment loans when they are deemed uncollectible or reach a predetermined number of days past due based on product, industry practice and other factors. Collection efforts may continue and recoveries may occur after a loan is charged against the AFLL.
While we use relevant information to recognize losses on loans, additional provisions for related losses may be necessary based on changes in economic conditions, customer circumstances and other credit risk factors.
The AFLL increased $2.4 million to $22.6 million at December 31, 2017 from $20.2 million at December 31, 2016 and was equal to 1.12% of total Portfolio Loans at December 31, 2017 compared to 1.26% at December 31, 2016.
Three of the four components of the allowance for loan losses outlined above increased during 2017. The allowance for loan losses related to specific loans decreased $2.3 million in 2017 due primarily to a $14.3 million, or 17.9%, decline in the balance of individually impaired loans as well as charge-offs. In particular, we received a full payoff in March 2017 on a commercial loan that had a specific reserve of $1.2 million at December 31, 2016. The allowance for loan losses related to other adversely rated commercial loans increased $0.7 million in 2017 primarily due to an increase in the balance of such loans included in this component to $27.2 million at December 31, 2017 from $11.8 million at December 31, 2016. The allowance for loan losses related to historical losses increased $2.2 million during 2017 due principally to slight upward adjustments in our probability of default and expected loss rates for commercial loans, an additional component of approximately $0.6 million added for loans secured by commercial real estate due primarily to emerging risks in this sector (such as retail store closings and potential overdevelopment in certain markets) and Portfolio Loan growth. We also extended our historical lookback period to be more representative of the probability of default and account for infrequent migration events and extremely low levels of watch credits. The allowance for loan losses related to subjective factors increased $1.7 million during 2017 primarily due to Portfolio Loan growth.
By comparison, three of the four components of the allowance for loan losses outlined above declined during 2016. The allowance for loan losses related to specific loans decreased $1.8 million in 2016 due primarily to a $9.3 million, or 10.4%, decline in the balance of individually impaired loans as well as charge-offs. The allowance
26
for loan losses related to other adversely rated commercial loans decreased $0.6 million in 2016 as the total balance of such loans included in this component decreased to $11.8 million at December 31, 2016, from $27.8 million at December 31, 2015. The allowance for loan losses related to historical losses decreased $0.3 million during 2016 due principally to the use of a lower estimated probability of default for homogenous mortgage and installment loans (resulting from lower loan net charge-offs and reduced levels of new defaults on loans over the relevant measurement period). The allowance for loan losses related to subjective factors increased $0.4 million due primarily to Portfolio Loan growth.
ALLOWANCE FOR LOSSES ON LOANS AND UNFUNDED COMMITMENTS
|
|
2017
|
2016
|
2015
|
|||||||||||||||
|
|
Loan
Losses |
Unfunded
Commitments |
Loan
Losses |
Unfunded
Commitments |
Loan
Losses |
Unfunded
Commitments |
||||||||||||
|
|
(Dollars in thousands)
|
|||||||||||||||||
|
Balance at beginning of year
|
$
|
20,234
|
|
$
|
650
|
|
$
|
22,570
|
|
$
|
652
|
|
$
|
25,990
|
|
$
|
539
|
|
|
Additions (deductions)
|
|
|
|
|
|
|
|
|
|
|
|
|
|
|
|
|
|
|
|
Provision for loan losses
|
|
1,199
|
|
|
—
|
|
|
(1,309
|
)
|
|
—
|
|
|
(2,714
|
)
|
|
—
|
|
|
Recoveries credited to allowance
|
|
4,205
|
|
|
—
|
|
|
4,619
|
|
|
|
|
|
5,022
|
|
|
—
|
|
|
Loans charged against the allowance
|
|
(3,051
|
)
|
|
—
|
|
|
(5,587
|
)
|
|
—
|
|
|
(5,728
|
)
|
|
—
|
|
|
Reclassification to loans held for sale
|
|
—
|
|
|
—
|
|
|
(59
|
)
|
|
—
|
|
|
—
|
|
|
—
|
|
|
Additions (deductions) included in non-interest expense
|
|
—
|
|
|
475
|
|
|
—
|
|
|
(2
|
)
|
|
—
|
|
|
113
|
|
|
Balance at end of year
|
$
|
22,587
|
|
$
|
1,125
|
|
$
|
20,234
|
|
$
|
650
|
|
$
|
22,570
|
|
$
|
652
|
|
|
Net loans charged against the allowance to average Portfolio Loans
|
|
(0.06
|
)%
|
|
|
|
|
0.06
|
%
|
|
|
|
|
0.05
|
%
|
|
|
|
In 2017, we recorded a net recovery of 0.06% to average loans (or $1.2 million). This compares to loan net charge-offs to average loans of 0.06% in 2016 (or $1.0 million) and 0.05% in 2015 (or $0.7 million). The net recoveries in 2017 occurred in the commercial loan and mortgage loan categories and primarily reflect reduced levels of non-performing loans, improvement in collateral liquidation values and on-going collection efforts on previously charged-off loans. The slight increase in loan net charge-offs in 2016 as compared to 2015 were in mortgage loans and deposit overdrafts.
Deposits and borrowings. Historically, the loyalty of our customer base has allowed us to price deposits competitively, contributing to a net interest margin that compares favorably to our peers. However, we still face a significant amount of competition for deposits within many of the markets served by our branch network, which limits our ability to materially increase deposits without adversely impacting the weighted-average cost of core deposits.
To attract new core deposits, we have implemented various account acquisition strategies as well as branch staff sales training. Account acquisition initiatives have historically generated increases in customer relationships. Over the past several years, we have also expanded our treasury management products and services for commercial businesses and municipalities or other governmental units and have also increased our sales calling efforts in order to attract additional deposit relationships from these sectors. We view long-term core deposit growth as an important objective. Core deposits generally provide a more stable and lower cost source of funds than alternative sources such as short-term borrowings. (See “Liquidity and capital resources.”)
Deposits totaled $2.40 billion and $2.23 billion at December 31, 2017 and 2016, respectively. The $174.8 million increase in deposits in 2017 is due to growth in checking, savings, reciprocal and brokered deposit account balances. Reciprocal deposits totaled $51.0 million and $38.7 million at December 31, 2017 and 2016, respectively. These deposits represent demand, money market and time deposits from our customers that have been placed through Promontory Interfinancial Network’s Insured Cash Sweep® service and Certificate of Deposit Account Registry Service®. These services allow our customers to access multi-million dollar FDIC deposit insurance on deposit balances greater than the standard FDIC insurance maximum. We also added $142.0 million of brokered time deposits during 2017. This increase, replaced in part, the run-off of time deposits with one municipal customer as described earlier under “Financial Condition - Summary.”
27
We cannot be sure that we will be able to maintain our current level of core deposits. In particular, those deposits that are uninsured may be susceptible to outflow. At December 31, 2017, we had an estimated $530.5 million of uninsured deposits. A reduction in core deposits would likely increase our need to rely on wholesale funding sources.
We have also implemented strategies that incorporate using federal funds purchased, other borrowings and Brokered CDs to fund a portion of our interest-earning assets. The use of such alternate sources of funds supplements our core deposits and is also a part of our asset/liability management efforts.
Other borrowings, comprised primarily of federal funds purchased and advances from the Federal Home Loan Bank (the “FHLB”), totaled $54.6 million and $9.4 million at December 31, 2017 and 2016, respectively.
As described above, we utilize wholesale funding, including federal funds purchased, FHLB borrowings and Brokered CDs to augment our core deposits and fund a portion of our assets. At December 31, 2017, our use of such wholesale funding sources (including reciprocal deposits) amounted to approximately $247.5 million, or 10.1% of total funding (deposits and total borrowings, excluding subordinated debentures). Because wholesale funding sources are affected by general market conditions, the availability of such funding may be dependent on the confidence these sources have in our financial condition and operations. The continued availability to us of these funding sources is not certain, and Brokered CDs may be difficult for us to retain or replace at attractive rates as they mature. Our liquidity may be constrained if we are unable to renew our wholesale funding sources or if adequate financing is not available in the future at acceptable rates of interest or at all. Our financial performance could also be affected if we are unable to maintain our access to funding sources or if we are required to rely more heavily on more expensive funding sources. In such case, our net interest income and results of operations could be adversely affected.
We historically employed derivative financial instruments to manage our exposure to changes in interest rates. We discontinued the active use of derivative financial instruments during 2008. We began to again utilize interest-rate swaps in 2014, primarily relating to our commercial lending activities. During 2017, 2016 and 2015, we entered into $39.1 million, $24.1 million and $24.3 million (original aggregate notional amounts), respectively, of interest rate swaps with commercial loan customers, which were offset with interest rate swaps that the Bank entered into with a broker-dealer. We recorded $0.413 million, $0.380 million and $0.412 million of fee income related to these transactions during 2017, 2016 and 2015, respectively. Also in 2017, we entered into $15.0 million (notional amount) of pay fixed interest rate swaps and $45.0 million (notional amount) of interest rate caps. These swaps and caps are hedging short-term wholesale funding.
Liquidity and capital resources. Liquidity risk is the risk of being unable to timely meet obligations as they come due at a reasonable funding cost or without incurring unacceptable losses. Our liquidity management involves the measurement and monitoring of a variety of sources and uses of funds. Our Consolidated Statements of Cash Flows categorize these sources and uses into operating, investing and financing activities. We primarily focus our liquidity management on maintaining adequate levels of liquid assets (primarily funds on deposit with the FRB and certain investment securities) as well as developing access to a variety of borrowing sources to supplement our deposit gathering activities and provide funds for purchasing investment securities or originating Portfolio Loans as well as to be able to respond to unforeseen liquidity needs.
Our primary sources of funds include our deposit base, secured advances from the FHLB, federal funds purchased borrowing facilities with other commercial banks, and access to the capital markets (for Brokered CDs).
At December 31, 2017, we had $446.8 million of time deposits that mature in the next 12 months. Historically, a majority of these maturing time deposits are renewed by our customers. Additionally, $1.85 billion of our deposits at December 31, 2017, were in account types from which the customer could withdraw the funds on demand. Changes in the balances of deposits that can be withdrawn upon demand are usually predictable and the total balances of these accounts have generally grown or have been stable over time as a result of our marketing and promotional activities. However, there can be no assurance that historical patterns of renewing time deposits or overall growth or stability in deposits will continue in the future.
We have developed contingency funding plans that stress test our liquidity needs that may arise from certain events such as an adverse change in our financial metrics (for example, credit quality or regulatory capital ratios). Our liquidity management also includes periodic monitoring that measures quick assets (defined generally as highly
28
liquid or short-term assets) to total assets, short-term liability dependence and basic surplus (defined as quick assets less volatile liabilities to total assets). Policy limits have been established for our various liquidity measurements and are monitored on a quarterly basis. In addition, we also prepare cash flow forecasts that include a variety of different scenarios.
We believe that we currently have adequate liquidity at our Bank because of our cash and cash equivalents, our portfolio of securities available for sale, our access to secured advances from the FHLB, our ability to issue Brokered CDs and our improved financial metrics.
We also believe that the available cash on hand at the parent company (including time deposits) of approximately $21.5 million as of December 31, 2017 provides sufficient liquidity resources at the parent company to meet operating expenses, to make interest payments on the subordinated debentures and to pay a cash dividend on our common stock for the foreseeable future.
In the normal course of business, we enter into certain contractual obligations. Such obligations include requirements to make future payments on debt and lease arrangements, contractual commitments for capital expenditures, and service contracts. The table below summarizes our significant contractual obligations at December 31, 2017.
CONTRACTUAL COMMITMENTS (1)
|
|
1 Year or Less
|
1-3 Years
|
3-5 Years
|
After
5 Years |
Total
|
||||||||||
|
|
(In thousands)
|
||||||||||||||
|
Time deposit maturities
|
$
|
446,835
|
|
$
|
81,405
|
|
$
|
26,036
|
|
$
|
542
|
|
$
|
554,818
|
|
|
FHLB advances
|
|
30,042
|
|
|
17,799
|
|
|
—
|
|
|
—
|
|
|
47,841
|
|
|
Subordinated debentures
|
|
—
|
|
|
—
|
|
|
—
|
|
|
35,569
|
|
|
35,569
|
|
|
Operating lease obligations
|
|
1,310
|
|
|
1,823
|
|
|
572
|
|
|
387
|
|
|
4,092
|
|
|
Purchase obligations (2)
|
|
2,226
|
|
|
4,452
|
|
|
557
|
|
|
—
|
|
|
7,235
|
|
|
Total
|
$
|
480,413
|
|
$
|
105,479
|
|
$
|
27,165
|
|
$
|
36,498
|
|
$
|
649,555
|
|
| (1) | Excludes approximately $0.5 million of accrued tax and interest relative to uncertain tax benefits due to the high degree of uncertainty as to when, or if, those amounts would be paid. |
| (2) | Includes contracts with a minimum annual payment of $1.0 million and are not cancellable within one year. |
Effective management of capital resources is critical to our mission to create value for our shareholders. In addition to common stock, our capital structure also currently includes cumulative trust preferred securities.
CAPITALIZATION
|
|
December 31,
|
|||||
|
|
2017
|
2016
|
||||
|
|
(In thousands)
|
|||||
|
Subordinated debentures
|
$
|
35,569
|
|
$
|
35,569
|
|
|
Amount not qualifying as regulatory capital
|
|
(1,069
|
)
|
|
(1,069
|
)
|
|
Amount qualifying as regulatory capital
|
|
34,500
|
|
|
34,500
|
|
|
Shareholders’ equity
|
|
|
|
|
|
|
|
Common stock
|
|
324,986
|
|
|
323,745
|
|
|
Accumulated deficit
|
|
(54,090
|
)
|
|
(65,657
|
)
|
|
Accumulated other comprehensive loss
|
|
(5,963
|
)
|
|
(9,108
|
)
|
|
Total shareholders’ equity
|
|
264,933
|
|
|
248,980
|
|
|
Total capitalization
|
$
|
299,433
|
|
$
|
283,480
|
|
We have three special purpose entities with $34.5 million of outstanding cumulative trust preferred securities. These special purpose entities issued common securities and provided cash to our parent company that in turn issued
29
subordinated debentures to these special purpose entities equal to the trust preferred securities and common securities. The subordinated debentures represent the sole asset of the special purpose entities. The common securities and subordinated debentures are included in our Consolidated Statements of Financial Condition.
The FRB has issued rules regarding trust preferred securities as a component of the Tier 1 capital of bank holding companies. The aggregate amount of trust preferred securities (and certain other capital elements) are limited to 25 percent of Tier 1 capital elements, net of goodwill (net of any associated deferred tax liability). The amount of trust preferred securities and certain other elements in excess of the limit can be included in Tier 2 capital, subject to restrictions. At the parent company, all of these securities qualified as Tier 1 capital at both December 31, 2017 and 2016. Although the Dodd-Frank Act further limited Tier 1 treatment for trust preferred securities, those new limits did not apply to our outstanding trust preferred securities. Further, the New Capital Rules grandfathered the treatment of our trust preferred securities as qualifying regulatory capital.
Common shareholders’ equity increased to $264.9 million at December 31, 2017 from $249.0 million at December 31, 2016 due primarily to our net income in 2017 and a decline in our accumulated other comprehensive loss that were partially offset by dividends. Our tangible common equity (“TCE”) totaled $263.3 million and $247.0 million, respectively, at those same dates. Our ratio of TCE to tangible assets was 9.45% and 9.70% at December 31, 2017 and 2016, respectively. TCE and the ratio of TCE to tangible assets are non-GAAP measures. TCE represents total common equity less intangible assets.
In January 2016 and 2017, our Board of Directors authorized share repurchase plans. Under the terms of these share repurchase plans, we were authorized to buy back up to 5% of our outstanding common stock (plus an additional $5.0 million for the 2016 plan). These repurchase plans expired on December 31, 2017 and 2016, respectively. During 2017, we did not repurchase any shares of our common stock. During 2016, we repurchased 1,153,136 shares of our comment stock at an average price of $14.62 per share.
In January 2018, our Board of Directors authorized another share repurchase plan. Under the terms of the 2018 share repurchase plan, we are authorized to buy back up to 5% of our outstanding common stock. This repurchase plan is authorized to last through December 31, 2018.
We pay a quarterly cash dividend on our common stock. These dividends totaled $0.42 per share and $0.34 per share in 2017 and 2016, respectively. In January 2018, our Board of Directors increased the quarterly cash dividend on our common stock by 25% (to $0.15 per share from $0.12 per share) effective with the February 15, 2018 dividend. This increase, in part, reflects the expected benefit to net income from a lower corporate federal income tax rate under H.R. 1. We generally favor a dividend payout ratio between 30% and 50% of net income.
As of December 31, 2017 and 2016, our Bank (and holding company) continued to meet the requirements to be considered “well-capitalized” under federal regulatory standards (also see note #20 to the Consolidated Financial Statements included within this report).
Asset/liability management. Interest-rate risk is created by differences in the cash flow characteristics of our assets and liabilities. Options embedded in certain financial instruments, including caps on adjustable-rate loans as well as borrowers’ rights to prepay fixed-rate loans, also create interest-rate risk.
Our asset/liability management efforts identify and evaluate opportunities to structure our statement of financial condition in a manner that is consistent with our mission to maintain profitable financial leverage within established risk parameters. We evaluate various opportunities and alternate asset/liability management strategies carefully and consider the likely impact on our risk profile as well as the anticipated contribution to earnings. The marginal cost of funds is a principal consideration in the implementation of our asset/liability management strategies, but such evaluations further consider interest-rate and liquidity risk as well as other pertinent factors. We have established parameters for interest-rate risk. We regularly monitor our interest-rate risk and report at least quarterly to our board of directors.
We employ simulation analyses to monitor our interest-rate risk profile and evaluate potential changes in our net interest income and market value of portfolio equity that result from changes in interest rates. The purpose of these simulations is to identify sources of interest-rate risk inherent in our Consolidated Statements of Financial Condition. The simulations do not anticipate any actions that we might initiate in response to changes in interest rates and, accordingly, the simulations do not provide a reliable forecast of anticipated results. The simulations are predicated
30
on immediate, permanent and parallel shifts in interest rates and generally assume that current loan and deposit pricing relationships remain constant. The simulations further incorporate assumptions relating to changes in customer behavior, including changes in prepayment rates on certain assets and liabilities.
CHANGES IN MARKET VALUE OF PORTFOLIO EQUITY AND NET INTEREST INCOME
|
Change in Interest Rates
|
Market
Value of Portfolio Equity (1) |
Percent
Change |
Net Interest
Income (2) |
Percent
Change |
||||||||
|
|
(Dollars in thousands)
|
|||||||||||
|
December 31, 2017
|
|
|
|
|
|
|
|
|
|
|
|
|
|
200 basis point rise
|
$
|
409,200
|
|
|
(1.23
|
)%
|
$99,100
|
|
2.27
|
%
|
||
|
100 basis point rise
|
|
417,100
|
|
|
0.68
|
|
98,600
|
|
1.75
|
|
||
|
Base-rate scenario
|
|
414,300
|
|
|
—
|
|
96,900
|
|
—
|
|
||
|
100 basis point decline
|
|
386,400
|
|
|
(6.73
|
)
|
91,600
|
|
(5.47
|
)
|
||
|
|
|
|
|
|
|
|
|
|
|
|
||
|
December 31, 2016
|
|
|
|
|
|
|
|
|
|
|
||
|
200 basis point rise
|
$
|
427,400
|
|
|
6.90
|
%
|
$84,800
|
|
6.94
|
%
|
||
|
100 basis point rise
|
|
417,800
|
|
|
4.50
|
|
82,500
|
|
4.04
|
|
||
|
Base-rate scenario
|
|
399,800
|
|
|
—
|
|
79,300
|
|
—
|
|
||
|
100 basis point decline
|
|
366,000
|
|
|
(8.45
|
)
|
73,500
|
|
(7.31
|
)
|
||
| (1) | Simulation analyses calculate the change in the net present value of our assets and liabilities, including debt and related financial derivative instruments, under parallel shifts in interest rates by discounting the estimated future cash flows using a market-based discount rate. Cash flow estimates incorporate anticipated changes in prepayment speeds and other embedded options. |
| (2) | Simulation analyses calculate the change in net interest income under immediate parallel shifts in interest rates over the next twelve months, based upon a static Consolidated Statement of Financial Condition, which includes debt and related financial derivative instruments, and do not consider loan fees. |
Accounting Standards Update. See note #1 to the Consolidated Financial Statements included elsewhere in this report for details on recently issued accounting pronouncements and their impact on our financial statements.
FAIR VALUATION OF FINANCIAL INSTRUMENTS
FASB Accounting Standards Codification (“ASC”) topic 820 - “Fair Value Measurements and Disclosures” (“ASC topic 820”) defines fair value as the exchange price that would be received for an asset or paid to transfer a liability (an exit price) in the principal or most advantageous market for the asset or liability in an orderly transaction between market participants on the measurement date.
We utilize fair value measurements to record fair value adjustments to certain financial instruments and to determine fair value disclosures. ASC topic 820 differentiates between those assets and liabilities required to be carried at fair value at every reporting period (“recurring”) and those assets and liabilities that are only required to be adjusted to fair value under certain circumstances (“nonrecurring”). Trading securities, securities available-for-sale, loans held for sale, capitalized mortgage loan servicing rights, and derivatives are financial instruments recorded at fair value on a recurring basis. Additionally, from time to time, we may be required to record at fair value other financial assets on a nonrecurring basis, such as loans held for investment and certain other assets. These nonrecurring fair value adjustments typically involve application of lower of cost or market accounting or write-downs of individual assets. See note #21 to the Consolidated Financial Statements for a complete discussion on our use of fair valuation of financial instruments and the related measurement techniques.
LITIGATION MATTERS
As described in “Recent Developments” we settled a litigation matter in December 2016 and recorded a $2.3 million expense in the fourth quarter of 2016. We are also involved in various other litigation matters in the ordinary course of business. At the present time, we do not believe any of these matters will have a significant impact
31
on our consolidated financial position or results of operations. The aggregate amount we have accrued for losses we consider probable as a result of these other litigation matters is immaterial. However, because of the inherent uncertainty of outcomes from any litigation matter, we believe it is reasonably possible we may incur losses in addition to the amounts we have accrued. At this time, we estimate the maximum amount of additional losses that are reasonably possible is insignificant. However, because of a number of factors, including the fact that certain of these litigation matters are still in their early stages, this maximum amount may change in the future.
The litigation matters described in the preceding paragraph primarily include claims that have been brought against us for damages, but do not include litigation matters where we seek to collect amounts owed to us by third parties (such as litigation initiated to collect delinquent loans). These excluded, collection-related matters may involve claims or counterclaims by the opposing party or parties, but we have excluded such matters from the disclosure contained in the preceding paragraph in all cases where we believe the possibility of us paying damages to any opposing party is remote. Risks associated with the likelihood that we will not collect the full amount owed to us, net of reserves, are disclosed elsewhere in this report.
CRITICAL ACCOUNTING POLICIES
Our accounting and reporting policies are in accordance with accounting principles generally accepted in the United States of America and conform to general practices within the banking industry. Accounting and reporting policies for the allowance for loan losses, capitalized mortgage loan servicing rights, and income taxes are deemed critical since they involve the use of estimates and require significant management judgments. Application of assumptions different than those that we have used could result in material changes in our financial position or results of operations.
Our methodology for determining the allowance and related provision for loan losses is described above in “Portfolio Loans and asset quality.” In particular, this area of accounting requires a significant amount of judgment because a multitude of factors can influence the ultimate collection of a loan or other type of credit. It is extremely difficult to precisely measure the amount of probable incurred losses in our loan portfolio. We use a rigorous process to attempt to accurately quantify the necessary allowance and related provision for loan losses, but there can be no assurance that our modeling process will successfully identify all of the probable incurred losses in our loan portfolio. As a result, we could record future provisions for loan losses that may be significantly different than the levels that we recorded in prior periods. In June 2016, the FASB issued ASU No. 2016-13 “Financial Instruments – Credit Losses (Topic 326), Measurement of Credit Losses on Financial Instruments” (“ASU 2016-13”). See note #1 to the Consolidated Financial Statements for a description of our implementation efforts related to ASU 2016-13.
At December 31, 2017 and 2016, we had approximately $15.7 million and $13.7 million, respectively, of mortgage loan servicing rights capitalized on our Consolidated Statements of Financial Condition. There are several critical assumptions involved in establishing the value of this asset including estimated future prepayment speeds on the underlying mortgage loans, the interest rate used to discount the net cash flows from the mortgage loan servicing, the estimated amount of ancillary income that will be received in the future (such as late fees) and the estimated cost to service the mortgage loans. We believe the assumptions that we utilize in our valuation are reasonable based upon accepted industry practices for valuing mortgage loan servicing rights and represent neither the most conservative or aggressive assumptions. As of January 1, 2017, we elected the fair value measurement method for our mortgage loan servicing rights (in lieu of the amortization method).
Our accounting for income taxes involves the valuation of our DTA primarily associated with net operating loss carryforwards and differences in the timing of the recognition of revenues and expenses for financial reporting and tax purposes. At December 31, 2017 we had gross deferred tax assets of $19.8 million, gross deferred tax liabilities of $4.7 million and no valuation allowance. This compares to gross deferred tax assets of $39.2 million, gross deferred tax liabilities of $5.3 million and a valuation allowance of $1.1 million at December 31, 2016. We assess whether a valuation allowance should be established against our DTA based on the consideration of all available evidence using a “more likely than not” standard. The ultimate realization of this asset is primarily based on generating future income. We concluded at both December 31, 2017 and 2016, that the realization of substantially all of our DTA continues to be more likely than not. In addition, 2017 includes a $6.0 million reduction of our DTA related to a remeasurement as described earlier under “Recent Developments.”
32
MANAGEMENT’S ANNUAL REPORT ON INTERNAL CONTROL OVER
FINANCIAL REPORTING
The management of Independent Bank Corporation is responsible for establishing and maintaining adequate internal control over financial reporting. Our internal control system was designed to provide reasonable assurance to us and the board of directors regarding the preparation and fair presentation of published financial statements.
All internal control systems, no matter how well designed, have inherent limitations. Therefore, even those systems determined to be effective can provide only reasonable assurance with respect to financial statement preparation and presentation.
We assessed the effectiveness of our internal control over financial reporting as of December 31, 2017. In making this assessment, we used the criteria established in the 2013 Internal Control – Integrated Framework issued by the Committee of Sponsoring Organizations of the Treadway Commission (COSO). Based on our assessment, management has concluded that as of December 31, 2017, the Company’s internal control over financial reporting was effective to provide reasonable assurance regarding the reliability of financial reporting and the preparation of financial statements for external purposes in accordance with generally accepted accounting principles.
There were no changes in our internal control over financial reporting during the quarter ended December 31, 2017, that have materially affected, or are reasonably likely to materially affect, our internal control over financial reporting.
Our independent registered public accounting firm has issued an audit report on the effectiveness of the Company’s internal control over financial reporting as of December 31, 2017. Their report immediately follows our report.
 |
 |
|
William B. Kessel
|
Robert N. Shuster
|
|
President and
Chief Executive Officer |
Executive Vice President
and Chief Financial Officer |
|
|
|
|
Independent Bank Corporation
March 7, 2018 |
|
33
REPORT OF INDEPENDENT REGISTERED PUBLIC ACCOUNTING FIRM
Shareholders and the Board of Directors of Independent Bank Corporation
Grand Rapids, Michigan
Opinions on the Financial Statements and Internal Control over Financial Reporting
We have audited the accompanying consolidated statements of financial condition of Independent Bank Corporation (the “Corporation”) as of December 31, 2017 and 2016, the related consolidated statements of operations, comprehensive income, shareholders’ equity, and cash flows for each of the years in the three-year period ended December 31, 2017, and the related notes (collectively referred to as the “financial statements”). We also have audited the Corporation’s internal control over financial reporting as of December 31, 2017, based on criteria established in Internal Control – Integrated Framework: (2013) issued by the Committee of Sponsoring Organizations of the Treadway Commission (COSO).
In our opinion, the financial statements referred to above present fairly, in all material respects, the financial position of the Corporation as of December 31, 2017 and 2016, and the results of its operations and its cash flows for each of the years in the three-year period ended December 31, 2017 in conformity with accounting principles generally accepted in the United States of America. Also in our opinion, the Corporation maintained, in all material respects, effective internal control over financial reporting as of December 31, 2017, based on criteria established in Internal Control – Integrated Framework: (2013) issued by COSO.
Basis for Opinions
The Corporation’s management is responsible for these financial statements, for maintaining effective internal control over financial reporting, and for its assessment of the effectiveness of internal control over financial reporting, included in the accompanying Management’s Annual Report on Internal Control over Financial Reporting. Our responsibility is to express an opinion on the Corporation’s financial statements and an opinion on the Corporation’s internal control over financial reporting based on our audits. We are a public accounting firm registered with the Public Company Accounting Oversight Board (United States) (“PCAOB”) and are required to be independent with respect to the Corporation in accordance with the U.S. federal securities laws and the applicable rules and regulations of the Securities and Exchange Commission and the PCAOB.
We conducted our audits in accordance with the standards of the PCAOB. Those standards require that we plan and perform the audits to obtain reasonable assurance about whether the financial statements are free of material misstatement, whether due to error or fraud, and whether effective internal control over financial reporting was maintained in all material respects.
Our audits of the financial statements included performing procedures to assess the risks of material misstatement of the financial statements, whether due to error or fraud, and performing procedures that respond to those risks. Such procedures included examining, on a test basis, evidence regarding the amounts and disclosures in the financial statements. Our audits also included evaluating the accounting principles used and significant estimates made by management, as well as evaluating the overall presentation of the financial statements. Our audit of internal control over financial reporting included obtaining an understanding of internal control over financial reporting, assessing the risk that a material weakness exists, and testing and evaluating the design and operating effectiveness of internal control based on the assessed risk. Our audits also included performing such other procedures as we considered necessary in the circumstances. We believe that our audits provide a reasonable basis for our opinions.
Definition and Limitations of Internal Control Over Financial Reporting
A company’s internal control over financial reporting is a process designed to provide reasonable assurance regarding the reliability of financial reporting and the preparation of financial statements for external purposes in accordance with generally accepted accounting principles. A company’s internal control over financial reporting includes those policies and procedures that (1) pertain to the maintenance of records that, in reasonable detail, accurately and fairly reflect the transactions and dispositions of the assets of the company; (2) provide reasonable assurance that transactions are recorded as necessary to permit preparation of financial statements in accordance with generally accepted accounting principles, and that receipts and expenditures of the company are being made only in accordance with authorizations of management and directors of the company; and (3) provide reasonable assurance regarding prevention or timely detection of unauthorized acquisition, use, or disposition of the company’s assets that could have a material effect on the financial statements.
34
Because of its inherent limitations, internal control over financial reporting may not prevent or detect misstatements. Also, projections of any evaluation of effectiveness to future periods are subject to the risk that controls may become inadequate because of changes in conditions, or that the degree of compliance with the policies or procedures may deteriorate.

We have served as the Corporation’s auditor since 2005.
Grand Rapids, Michigan
March 7, 2018
35
CONSOLIDATED STATEMENTS OF FINANCIAL CONDITION
|
|
December 31,
|
|||||
|
|
2017
|
2016
|
||||
|
|
(In thousands, except share amounts)
|
|||||
|
ASSETS
|
|
|
|
|
|
|
|
Cash and due from banks
|
$
|
36,994
|
|
$
|
35,238
|
|
|
Interest bearing deposits
|
|
17,744
|
|
|
47,956
|
|
|
Cash and Cash Equivalents
|
|
54,738
|
|
|
83,194
|
|
|
Interest bearing deposits - time
|
|
2,739
|
|
|
5,591
|
|
|
Trading securities
|
|
455
|
|
|
410
|
|
|
Securities available for sale
|
|
522,925
|
|
|
610,616
|
|
|
Federal Home Loan Bank and Federal Reserve Bank stock, at cost
|
|
15,543
|
|
|
15,543
|
|
|
Loans held for sale, carried at fair value
|
|
39,436
|
|
|
35,946
|
|
|
Payment plan receivables and other assets held for sale
|
|
—
|
|
|
33,360
|
|
|
Loans
|
|
|
|
|
|
|
|
Commercial
|
|
853,260
|
|
|
804,017
|
|
|
Mortgage
|
|
849,530
|
|
|
538,615
|
|
|
Installment
|
|
316,027
|
|
|
265,616
|
|
|
Total Loans
|
|
2,018,817
|
|
|
1,608,248
|
|
|
Allowance for loan losses
|
|
(22,587
|
)
|
|
(20,234
|
)
|
|
Net Loans
|
|
1,996,230
|
|
|
1,588,014
|
|
|
Other real estate and repossessed assets
|
|
1,643
|
|
|
5,004
|
|
|
Property and equipment, net
|
|
39,149
|
|
|
40,175
|
|
|
Bank-owned life insurance
|
|
54,572
|
|
|
54,033
|
|
|
Deferred tax assets, net
|
|
15,089
|
|
|
32,818
|
|
|
Capitalized mortgage loan servicing rights
|
|
15,699
|
|
|
13,671
|
|
|
Other intangibles
|
|
1,586
|
|
|
1,932
|
|
|
Accrued income and other assets
|
|
29,551
|
|
|
28,643
|
|
|
Total Assets
|
$
|
2,789,355
|
|
$
|
2,548,950
|
|
|
|
|
|
|
|
|
|
|
LIABILITIES AND SHAREHOLDERS' EQUITY
|
|
|
|
|
|
|
|
Deposits
|
|
|
|
|
|
|
|
Non-interest bearing
|
$
|
768,333
|
|
$
|
717,472
|
|
|
Savings and interest-bearing checking
|
|
1,064,391
|
|
|
1,015,724
|
|
|
Reciprocal
|
|
50,979
|
|
|
38,657
|
|
|
Time
|
|
374,872
|
|
|
453,866
|
|
|
Brokered time
|
|
141,959
|
|
|
—
|
|
|
Total Deposits
|
|
2,400,534
|
|
|
2,225,719
|
|
|
Other borrowings
|
|
54,600
|
|
|
9,433
|
|
|
Subordinated debentures
|
|
35,569
|
|
|
35,569
|
|
|
Other liabilities held for sale
|
|
—
|
|
|
718
|
|
|
Accrued expenses and other liabilities
|
|
33,719
|
|
|
28,531
|
|
|
Total Liabilities
|
|
2,524,422
|
|
|
2,299,970
|
|
|
|
|
|
|
|
|
|
|
Commitments and contingent liabilities
|
|
|
|
|
|
|
|
|
|
|
|
|
|
|
|
Shareholders’ Equity
|
|
|
|
|
|
|
|
Preferred stock, no par value, 200,000 shares authorized; none issued or outstanding
|
|
—
|
|
|
—
|
|
|
Common stock, no par value, 500,000,000 shares authorized; issued and outstanding: 21,333,869 shares at December 31, 2017 and 21,258,092 shares at December 31, 2016
|
|
324,986
|
|
|
323,745
|
|
|
Accumulated deficit
|
|
(54,054
|
)
|
|
(65,657
|
)
|
|
Accumulated other comprehensive loss
|
|
(5,999
|
)
|
|
(9,108
|
)
|
|
Total Shareholders’ Equity
|
|
264,933
|
|
|
248,980
|
|
|
Total Liabilities and Shareholders’ Equity
|
$
|
2,789,355
|
|
$
|
2,548,950
|
|
See accompanying notes to consolidated financial statements
36
CONSOLIDATED STATEMENTS OF OPERATIONS
|
|
Year Ended December 31,
|
||||||||
|
|
2017
|
2016
|
2015
|
||||||
|
|
(In thousands, except per share amounts)
|
||||||||
|
INTEREST INCOME
|
|
|
|
|
|
|
|
|
|
|
Interest and fees on loans
|
$
|
84,281
|
|
$
|
74,157
|
|
$
|
70,930
|
|
|
Interest on securities
|
|
|
|
|
|
|
|
|
|
|
Taxable
|
|
10,928
|
|
|
9,921
|
|
|
7,805
|
|
|
Tax-exempt
|
|
2,000
|
|
|
1,250
|
|
|
907
|
|
|
Other investments
|
|
1,100
|
|
|
1,195
|
|
|
1,200
|
|
|
Total Interest Income
|
|
98,309
|
|
|
86,523
|
|
|
80,842
|
|
|
INTEREST EXPENSE
|
|
|
|
|
|
|
|
|
|
|
Deposits
|
|
6,775
|
|
|
4,941
|
|
|
4,009
|
|
|
Other borrowings and subordinated debentures
|
|
2,348
|
|
|
1,941
|
|
|
1,847
|
|
|
Total Interest Expense
|
|
9,123
|
|
|
6,882
|
|
|
5,856
|
|
|
Net Interest Income
|
|
89,186
|
|
|
79,641
|
|
|
74,986
|
|
|
Provision for loan losses
|
|
1,199
|
|
|
(1,309
|
)
|
|
(2,714
|
)
|
|
Net Interest Income After Provision for Loan Losses
|
|
87,987
|
|
|
80,950
|
|
|
77,700
|
|
|
NON-INTEREST INCOME
|
|
|
|
|
|
|
|
|
|
|
Service charges on deposit accounts
|
|
12,673
|
|
|
12,406
|
|
|
12,389
|
|
|
Interchange income
|
|
8,023
|
|
|
7,938
|
|
|
8,481
|
|
|
Net gains on assets
|
|
|
|
|
|
|
|
|
|
|
Mortgage loans
|
|
11,762
|
|
|
10,566
|
|
|
7,448
|
|
|
Securities
|
|
260
|
|
|
563
|
|
|
20
|
|
|
Mortgage loan servicing, net
|
|
1,647
|
|
|
2,222
|
|
|
1,751
|
|
|
Net gain on branch sale
|
|
—
|
|
|
—
|
|
|
1,193
|
|
|
Other
|
|
8,168
|
|
|
8,603
|
|
|
8,848
|
|
|
Total Non-interest Income
|
|
42,533
|
|
|
42,298
|
|
|
40,130
|
|
|
NON-INTEREST EXPENSE
|
|
|
|
|
|
|
|
|
|
|
Compensation and employee benefits
|
|
55,089
|
|
|
49,579
|
|
|
48,186
|
|
|
Occupancy, net
|
|
8,102
|
|
|
8,023
|
|
|
8,369
|
|
|
Data processing
|
|
7,657
|
|
|
7,952
|
|
|
7,944
|
|
|
Furniture, fixtures and equipment
|
|
3,870
|
|
|
3,912
|
|
|
3,892
|
|
|
Communications
|
|
2,684
|
|
|
3,142
|
|
|
2,957
|
|
|
Loan and collection
|
|
2,230
|
|
|
2,512
|
|
|
3,609
|
|
|
Advertising
|
|
1,905
|
|
|
1,856
|
|
|
2,121
|
|
|
Legal and professional
|
|
1,892
|
|
|
1,742
|
|
|
2,013
|
|
|
Interchange expense
|
|
1,156
|
|
|
1,111
|
|
|
1,125
|
|
|
FDIC deposit insurance
|
|
894
|
|
|
1,049
|
|
|
1,366
|
|
|
Credit card and bank service fees
|
|
529
|
|
|
791
|
|
|
797
|
|
|
Merger related expense
|
|
284
|
|
|
—
|
|
|
—
|
|
|
Net (gains) losses on other real estate and repossessed assets
|
|
(606
|
)
|
|
250
|
|
|
(180
|
)
|
|
Litigation settlement expense
|
|
—
|
|
|
2,300
|
|
|
—
|
|
|
Loss on sale of payment plan business
|
|
—
|
|
|
320
|
|
|
—
|
|
|
Other
|
|
6,396
|
|
|
5,808
|
|
|
6,251
|
|
|
Total Non-interest Expense
|
|
92,082
|
|
|
90,347
|
|
|
88,450
|
|
|
Income Before Income Tax
|
|
38,438
|
|
|
32,901
|
|
|
29,380
|
|
|
Income tax expense
|
|
17,963
|
|
|
10,135
|
|
|
9,363
|
|
|
Net Income
|
$
|
20,475
|
|
$
|
22,766
|
|
$
|
20,017
|
|
|
Net income per common share
|
|
|
|
|
|
|
|
|
|
|
Basic
|
$
|
0.96
|
|
$
|
1.06
|
|
$
|
0.88
|
|
|
Diluted
|
$
|
0.95
|
|
$
|
1.05
|
|
$
|
0.86
|
|
|
Cash dividends declared and paid per common share
|
$
|
0.42
|
|
$
|
0.34
|
|
$
|
0.26
|
|
See accompanying notes to consolidated financial statements
37
CONSOLIDATED STATEMENTS OF COMPREHENSIVE INCOME
|
|
Year Ended December 31,
|
||||||||
|
|
2017
|
2016
|
2015
|
||||||
|
|
(In thousands)
|
||||||||
|
Net income
|
$
|
20,475
|
|
$
|
22,766
|
|
$
|
20,017
|
|
|
Other comprehensive income (loss)
|
|
|
|
|
|
|
|
|
|
|
Securities available for sale
|
|
|
|
|
|
|
|
|
|
|
Unrealized gain (loss) arising during period
|
|
4,065
|
|
|
(4,465
|
)
|
|
(540
|
)
|
|
Change in unrealized gains and losses for which a portion of other than temporary impairment has been recognized in earnings
|
|
186
|
|
|
40
|
|
|
—
|
|
|
Reclassification adjustments for gains included in earnings
|
|
(215
|
)
|
|
(301
|
)
|
|
(75
|
)
|
|
Unrealized gains (losses) recognized in other comprehensive income (loss) on securities available for sale
|
|
4,036
|
|
|
(4,726
|
)
|
|
(615
|
)
|
|
Income tax expense (benefit)
|
|
1,413
|
|
|
(1,654
|
)
|
|
(215
|
)
|
|
Unrealized gains (losses) recognized in other comprehensive income (loss) on securities available for sale, net of tax
|
|
2,623
|
|
|
(3,072
|
)
|
|
(400
|
)
|
|
Derivative instruments
|
|
|
|
|
|
|
|
|
|
|
Unrealized gain arising during period
|
|
324
|
|
|
—
|
|
|
—
|
|
|
Reclassification adjustment for expense recognized in earnings
|
|
18
|
|
|
—
|
|
|
—
|
|
|
Unrealized gains recognized in other comprehensive income (loss) on derivative instruments
|
|
342
|
|
|
—
|
|
|
—
|
|
|
Income tax expense
|
|
120
|
|
|
—
|
|
|
—
|
|
|
Unrealized gains recognized in other comprehensive income (loss) on derivative instruments, net of tax
|
|
222
|
|
|
—
|
|
|
—
|
|
|
Other comprehensive income (loss)
|
|
2,845
|
|
|
(3,072
|
)
|
|
(400
|
)
|
|
Comprehensive income
|
$
|
23,320
|
|
$
|
19,694
|
|
$
|
19,617
|
|
See accompanying notes to consolidated financial statements
38
CONSOLIDATED STATEMENTS OF SHAREHOLDERS' EQUITY
|
|
Common
Stock |
Accumulated
Deficit |
Accumulated
Other Comprehensive Loss |
Total
Shareholders’ Equity |
||||||||
|
Balances at January 1, 2015
|
$
|
352,462
|
|
$
|
(96,455
|
)
|
$
|
(5,636
|
)
|
$
|
250,371
|
|
|
Net income for 2015
|
|
—
|
|
|
20,017
|
|
|
—
|
|
|
20,017
|
|
|
Cash dividends declared, $.26 per share
|
|
—
|
|
|
(5,896
|
)
|
|
—
|
|
|
(5,896
|
)
|
|
Repurchase of 967,199 shares of common stock
|
|
(13,498
|
)
|
|
—
|
|
|
—
|
|
|
(13,498
|
)
|
|
Issuance of 39,610 shares of common stock
|
|
112
|
|
|
—
|
|
|
—
|
|
|
112
|
|
|
Share based compensation (issuance of 299,263 shares of common stock)
|
|
1,477
|
|
|
—
|
|
|
—
|
|
|
1,477
|
|
|
Share based compensation withholding obligation (withholding of 77,624 shares of common stock)
|
|
(1,091
|
)
|
|
—
|
|
|
—
|
|
|
(1,091
|
)
|
|
Other comprehensive loss
|
|
—
|
|
|
—
|
|
|
(400
|
)
|
|
(400
|
)
|
|
Balances at December 31, 2015
|
|
339,462
|
|
|
(82,334
|
)
|
|
(6,036
|
)
|
|
251,092
|
|
|
Cumulative effect of change in accounting principle
|
|
62
|
|
|
1,185
|
|
|
—
|
|
|
1,247
|
|
|
Balances at December 31, 2015, as adjusted
|
|
339,524
|
|
|
(81,149
|
)
|
|
(6,036
|
)
|
|
252,339
|
|
|
Net income for 2016
|
|
—
|
|
|
22,766
|
|
|
—
|
|
|
22,766
|
|
|
Cash dividends declared, $.34 per share
|
|
—
|
|
|
(7,274
|
)
|
|
—
|
|
|
(7,274
|
)
|
|
Repurchase of 1,153,136 shares of common stock
|
|
(16,854
|
)
|
|
—
|
|
|
—
|
|
|
(16,854
|
)
|
|
Issuance of 21,402 shares of common stock
|
|
82
|
|
|
—
|
|
|
—
|
|
|
82
|
|
|
Share based compensation (issuance of 180,380 shares of common stock)
|
|
1,620
|
|
|
—
|
|
|
—
|
|
|
1,620
|
|
|
Share based compensation withholding obligation (withholding of 41,927 shares of common stock)
|
|
(627
|
)
|
|
—
|
|
|
—
|
|
|
(627
|
)
|
|
Other comprehensive loss
|
|
—
|
|
|
—
|
|
|
(3,072
|
)
|
|
(3,072
|
)
|
|
Balances at December 31, 2016
|
|
323,745
|
|
|
(65,657
|
)
|
|
(9,108
|
)
|
|
248,980
|
|
|
Cumulative effect of change in accounting principle
|
|
—
|
|
|
52
|
|
|
300
|
|
|
352
|
|
|
Balances at December 31, 2016, as adjusted
|
|
323,745
|
|
|
(65,605
|
)
|
|
(8,808
|
)
|
|
249,332
|
|
|
Net income for 2017
|
|
—
|
|
|
20,475
|
|
|
—
|
|
|
20,475
|
|
|
Cash dividends declared, $.42 per share
|
|
—
|
|
|
(8,960
|
)
|
|
—
|
|
|
(8,960
|
)
|
|
Issuance of 27,046 shares of common stock
|
|
72
|
|
|
—
|
|
|
—
|
|
|
72
|
|
|
Share based compensation (issuance of 71,256 shares of common stock)
|
|
1,748
|
|
|
—
|
|
|
—
|
|
|
1,748
|
|
|
Share based compensation withholding obligation (withholding of 22,525 shares of common stock)
|
|
(579
|
)
|
|
—
|
|
|
—
|
|
|
(579
|
)
|
|
Reclassification of certain deferred tax effects
|
|
—
|
|
|
36
|
|
|
(36
|
)
|
|
—
|
|
|
Other comprehensive income
|
|
—
|
|
|
—
|
|
|
2,845
|
|
|
2,845
|
|
|
Balances at December 31, 2017
|
$
|
324,986
|
|
$
|
(54,054
|
)
|
$
|
(5,999
|
)
|
$
|
264,933
|
|
See accompanying notes to consolidated financial statements
39
CONSOLIDATED STATEMENTS OF CASH FLOWS
|
|
Year Ended December 31,
|
||||||||
|
|
2017
|
2016
|
2015
|
||||||
|
|
(In thousands)
|
||||||||
|
Net Income
|
$
|
20,475
|
|
$
|
22,766
|
|
$
|
20,017
|
|
|
ADJUSTMENTS TO RECONCILE NET INCOME TO NET CASH FROM OPERATING ACTIVITIES
|
|
|
|
|
|
|
|
|
|
|
Proceeds from sales of loans held for sale
|
|
434,682
|
|
|
324,828
|
|
|
288,852
|
|
|
Disbursements for loans held for sale
|
|
(426,410
|
)
|
|
(322,342
|
)
|
|
(285,608
|
)
|
|
Provision for loan losses
|
|
1,199
|
|
|
(1,309
|
)
|
|
(2,714
|
)
|
|
Deferred income tax expense
|
|
16,009
|
|
|
9,718
|
|
|
9,212
|
|
|
Deferred loan fees and costs
|
|
(5,159
|
)
|
|
(1,911
|
)
|
|
(1,234
|
)
|
|
Net depreciation, amortization of intangible assets and premiums and accretion of discounts on securities, loans and interest bearing deposits — time
|
|
6,957
|
|
|
5,216
|
|
|
4,553
|
|
|
Net gains on mortgage loans
|
|
(11,762
|
)
|
|
(10,566
|
)
|
|
(7,448
|
)
|
|
Net gains on securities
|
|
(260
|
)
|
|
(563
|
)
|
|
(20
|
)
|
|
Net (gains) losses on other real estate and repossessed assets
|
|
(606
|
)
|
|
250
|
|
|
(180
|
)
|
|
Share based compensation
|
|
1,748
|
|
|
1,620
|
|
|
1,477
|
|
|
Litigation settlement expense
|
|
—
|
|
|
2,300
|
|
|
—
|
|
|
Loss on sale of payment plan business
|
|
—
|
|
|
320
|
|
|
—
|
|
|
Net gain on branch sale
|
|
—
|
|
|
—
|
|
|
(1,193
|
)
|
|
Increase in accrued income and other assets
|
|
(3,708
|
)
|
|
(7,182
|
)
|
|
(1,483
|
)
|
|
Increase (decrease) in accrued expenses and other liabilities
|
|
5,442
|
|
|
559
|
|
|
(1,376
|
)
|
|
Total Adjustments
|
|
18,132
|
|
|
938
|
|
|
2,838
|
|
|
Net Cash From Operating Activities
|
|
38,607
|
|
|
23,704
|
|
|
22,855
|
|
|
CASH FLOW USED IN INVESTING ACTIVITIES
|
|
|
|
|
|
|
|
|
|
|
Proceeds from the sale of securities available for sale
|
|
17,308
|
|
|
64,103
|
|
|
12,037
|
|
|
Proceeds from maturities, prepayments and calls of securities available for sale
|
|
173,723
|
|
|
203,029
|
|
|
167,040
|
|
|
Purchases of securities available for sale
|
|
(100,584
|
)
|
|
(297,925
|
)
|
|
(234,693
|
)
|
|
Purchases of interest bearing deposits - time
|
|
—
|
|
|
—
|
|
|
(4,595
|
)
|
|
Proceeds from the maturity of interest bearing deposits - time
|
|
2,850
|
|
|
6,253
|
|
|
6,222
|
|
|
Redemption of Federal Home Loan Bank and Federal Reserve Bank stock
|
|
—
|
|
|
371
|
|
|
4,906
|
|
|
Purchase of Federal Reserve Bank stock
|
|
—
|
|
|
(443
|
)
|
|
(458
|
)
|
|
Net increase in portfolio loans (loans originated, net of principal payments)
|
|
(406,859
|
)
|
|
(107,472
|
)
|
|
(74,343
|
)
|
|
Purchase of portfolio loans
|
|
—
|
|
|
(15,000
|
)
|
|
(32,872
|
)
|
|
Cash received from the sale of Mepco Finance Corporation assets, net
|
|
33,446
|
|
|
—
|
|
|
—
|
|
|
Net cash paid for branch sale
|
|
—
|
|
|
—
|
|
|
(7,229
|
)
|
|
Proceeds from the collection of vehicle service contract counterparty receivables
|
|
528
|
|
|
4,786
|
|
|
1,092
|
|
|
Proceeds from the sale of other real estate and repossessed assets
|
|
5,703
|
|
|
4,251
|
|
|
6,179
|
|
|
Proceeds from bank-owned life insurance
|
|
523
|
|
|
2,235
|
|
|
—
|
|
|
Proceeds from the sale of property and equipment
|
|
26
|
|
|
416
|
|
|
555
|
|
|
Capital expenditures
|
|
(4,242
|
)
|
|
(3,459
|
)
|
|
(4,354
|
)
|
|
Net Cash Used in Investing Activities
|
|
(277,578
|
)
|
|
(138,855
|
)
|
|
(160,513
|
)
|
|
CASH FLOW FROM FINANCING ACTIVITIES
|
|
|
|
|
|
|
|
|
|
|
Net increase in total deposits
|
|
174,815
|
|
|
139,756
|
|
|
170,314
|
|
|
Net increase (decrease) in other borrowings
|
|
6,754
|
|
|
—
|
|
|
(1
|
)
|
|
Proceeds from Federal Home Loan Bank advances
|
|
622,000
|
|
|
—
|
|
|
100
|
|
|
Payments of Federal Home Loan Bank advances
|
|
(583,587
|
)
|
|
(2,521
|
)
|
|
(615
|
)
|
|
Dividends paid
|
|
(8,960
|
)
|
|
(7,274
|
)
|
|
(5,896
|
)
|
|
Proceeds from issuance of common stock
|
|
72
|
|
|
82
|
|
|
112
|
|
|
Repurchase of common stock
|
|
—
|
|
|
(16,854
|
)
|
|
(13,498
|
)
|
|
Share based compensation withholding obligation
|
|
(579
|
)
|
|
(627
|
)
|
|
(1,091
|
)
|
|
Net Cash From Financing Activities
|
|
210,515
|
|
|
112,562
|
|
|
149,425
|
|
|
Net Increase (Decrease) in Cash and Cash Equivalents
|
|
(28,456
|
)
|
|
(2,589
|
)
|
|
11,767
|
|
|
Cash and Cash Equivalents at Beginning of Year
|
|
83,194
|
|
|
85,783
|
|
|
74,016
|
|
|
Cash and Cash Equivalents at End of Year
|
$
|
54,738
|
|
$
|
83,194
|
|
$
|
85,783
|
|
|
Cash paid during the year for
|
|
|
|
|
|
|
|
|
|
|
Interest
|
$
|
9,163
|
|
$
|
6,416
|
|
$
|
5,769
|
|
|
Income taxes
|
|
1,970
|
|
|
563
|
|
|
295
|
|
|
Transfers to other real estate and repossessed assets
|
|
1,735
|
|
|
2,355
|
|
|
6,694
|
|
|
Transfer of payment plan receivables to vehicle service contract counterparty receivables
|
|
—
|
|
|
200
|
|
|
1,203
|
|
|
Purchase of securities available for sale and interest bearing deposits - time not yet settled
|
|
1,000
|
|
|
1,582
|
|
|
—
|
|
|
Transfers to payment plan receivables and other assets held for sale
|
|
—
|
|
|
33,360
|
|
|
—
|
|
|
Transfers to other liabilities held for sale
|
|
—
|
|
|
718
|
|
|
—
|
|
See accompanying notes to consolidated financial statements
40
NOTES TO CONSOLIDATED FINANCIAL STATEMENTS
The accounting and reporting policies and practices of Independent Bank Corporation and subsidiaries (“IBCP”) conform to accounting principles generally accepted in the United States of America and prevailing practices within the banking industry. Our critical accounting policies include the determination of the allowance for loan losses (“AFLL”), the valuation of capitalized mortgage loan servicing rights and the valuation of deferred tax assets. We are required to make material estimates and assumptions that are particularly susceptible to changes in the near term as we prepare the consolidated financial statements and report amounts for each of these items. Actual results may vary from these estimates.
Our subsidiary Independent Bank (“Bank”) transacts business in the single industry of commercial banking. Our Bank’s activities cover traditional phases of commercial banking, including checking and savings accounts, commercial lending, direct and indirect consumer financing and mortgage lending. Our principal markets are the rural and suburban communities across Lower Michigan and Ohio that are served by our Bank’s branches and loan production offices. Through April, 2017 we also purchased payment plans from companies (which we referred to as “counterparties”) that provided vehicle service contracts and similar products to consumers, through our wholly owned subsidiary, Mepco Finance Corporation (“Mepco”) which was sold effective May 1, 2017. See note #26. At December 31, 2017, 73.9% of our Bank’s loan portfolio was secured by real estate.
PRINCIPLES OF CONSOLIDATION — The consolidated financial statements include the accounts of Independent Bank Corporation and its subsidiaries. The income, expenses, assets and liabilities of the subsidiaries are included in the respective accounts of the consolidated financial statements, after elimination of all material intercompany accounts and transactions.
STATEMENTS OF CASH FLOWS — For purposes of reporting cash flows, cash and cash equivalents include cash on hand, amounts due from banks, interest bearing deposits and federal funds sold. Generally, federal funds are sold for one-day periods. We report net cash flows for customer loan and deposit transactions, for short-term borrowings and for vehicle service contract counterparty payables prior to the sale of Mepco.
INTEREST BEARING DEPOSITS — Interest bearing deposits consist of overnight deposits with the Federal Reserve Bank.
INTEREST BEARING DEPOSITS - TIME — Interest bearing deposits - time consist of deposits with original maturities of 3 months or more.
LOANS HELD FOR SALE — Mortgage loans originated and intended for sale in the secondary market are carried at fair value. Fair value adjustments, as well as realized gains and losses, are recorded in current earnings.
PAYMENT PLAN RECEIVABLES AND OTHER ASSETS HELD FOR SALE — On December 30, 2016 Mepco executed an Asset Purchase Agreement (the “APA”) with Seabury Asset Management LLC (“Seabury”). Pursuant to the terms of the APA, Mepco sold its payment plan processing business, payment plan receivables, commercial loans and certain other assets to Seabury, who also assumed certain liabilities of Mepco effective May 1, 2017. These assets and liabilities are categorized as “held for sale” in our December 31, 2016 Consolidated Statement of Financial Condition. There were no fair value adjustments recorded in 2017 related to the sale of Mepco. See note #26.
OPERATING SEGMENTS — While chief decision-makers monitor the revenue streams of our various products and services, operations are managed and financial performance is evaluated as one single unit. Discrete financial information is not available other than on a consolidated basis for material lines of business. Prior to 2016, we reported on two segments: Independent Bank and Mepco. However, given the significant reduction in the size of Mepco’s business and its relative immateriality, we eliminated any separate segment reporting on Mepco during 2016.
CAPITALIZED MORTGAGE LOAN SERVICING RIGHTS — During the first quarter of 2017, we adopted the fair value method of accounting for our capitalized mortgage loan servicing rights pursuant to Financial Accounting Standards Board (“FASB”) Accounting Standards Codification topic 860 – “Transfers and Servicing”. Prior to January 1, 2017, we were accounting for our capitalized mortgage loan servicing rights under the amortization method. We adopted the fair value method using a modified retrospective adjustment to beginning accumulated deficit. The impact of the adoption of the fair value method is summarized in the table below under Adoption of New Accounting Standards. The adjustments below reflect the recording of a $0.54 million increase in the fair value of
41
NOTES TO CONSOLIDATED FINANCIAL STATEMENTS — (Continued)
our capitalized mortgage loan servicing rights with a $0.19 million reduction in deferred tax assets, net for a net impact on accumulated deficit and total equity of $0.35 million.
We recognize as separate assets the rights to service mortgage loans for others. The fair value of capitalized mortgage loan servicing rights has been determined based upon fair value indications for similar servicing. Under the fair value method we measure capitalized mortgage loan servicing rights at fair value at each reporting date and report changes in fair value of capitalized mortgage loan servicing rights in earnings in the period in which the changes occur and are included in mortgage loan servicing, net in the Consolidated Statements of Operations. The fair values of capitalized mortgage loan servicing rights are subject to significant fluctuations as a result of changes in estimated and actual prepayment speeds and default rates and losses. Prior to January 1, 2017, capitalized mortgage loan servicing rights were amortized in proportion to and over the period of estimated net loan servicing income. We assessed capitalized mortgage loan servicing rights for impairment based on the fair value of those rights. For purposes of measuring impairment, the characteristics used included interest rate, term and type. Amortization of and changes in the impairment reserve on capitalized mortgage loan servicing rights were included in mortgage loan servicing, net in the Consolidated Statements of Operations.
Mortgage loan servicing income is recorded for fees earned for servicing loans previously sold. The fees are generally based on a contractual percentage of the outstanding principal and are recorded as income when earned. Mortgage loan servicing fees, excluding fair value changes or amortization of and changes in the impairment reserve on capitalized mortgage loan servicing rights, totaled $4.4 million, $4.1 million and $4.1 million for the years ended December 31, 2017, 2016 and 2015, respectively. Late fees and ancillary fees related to loan servicing are not material.
TRANSFERS OF FINANCIAL ASSETS — Transfers of financial assets are accounted for as sales when control over the assets has been relinquished. Control over transferred assets is deemed to be surrendered when the assets have been isolated from us, the transferee obtains the right (free of conditions that constrain it from taking advantage of that right) to pledge or exchange the transferred assets, and we do not maintain effective control over the transferred assets through an agreement to repurchase them before their maturity.
SECURITIES — We classify our securities as trading, held to maturity or available for sale. Trading securities are bought and held principally for the purpose of selling them in the near term and are reported at fair value with realized and unrealized gains and losses included in earnings. Securities held to maturity represent those securities for which we have the positive intent and ability to hold until maturity and are reported at cost, adjusted for amortization of premiums and accretion of discounts computed on the level-yield method. We did not have any securities held to maturity at December 31, 2017 and 2016. Securities available for sale represent those securities not classified as trading or held to maturity and are reported at fair value with unrealized gains and losses, net of applicable income taxes reported in other comprehensive income (loss).
We evaluate securities for other than temporary impairment (“OTTI”) at least on a quarterly basis and more frequently when economic or market conditions warrant such an evaluation. In performing this evaluation, management considers (1) the length of time and extent that fair value has been less than cost, (2) the financial condition and near term prospects of the issuer, (3) the impact of changes in market interest rates on the market value of the security and (4) an assessment of whether we intend to sell, or it is more likely than not that we will be required to sell a security in an unrealized loss position before recovery of its amortized cost basis. For securities that do not meet the aforementioned recovery criteria, the amount of impairment recognized in earnings is limited to the amount related to credit losses, while impairment related to other factors is recognized in other comprehensive income (loss). The credit loss is defined as the difference between the present value of the cash flows expected to be collected and the amortized cost basis.
Gains and losses realized on the sale of securities available for sale are determined using the specific identification method and are recognized on a trade-date basis.
FEDERAL HOME LOAN BANK (“FHLB”) STOCK — Our Bank subsidiary is a member of the FHLB system. Members are required to own a certain amount of stock based on the level of borrowings and other factors, and may invest in additional amounts. FHLB stock is carried at cost, classified as a restricted security, and periodically evaluated for impairment based on ultimate recovery of par value. Both cash and stock dividends are reported as income in interest income-other investments on the Consolidated Statements of Operations.
42
NOTES TO CONSOLIDATED FINANCIAL STATEMENTS — (Continued)
FEDERAL RESERVE BANK (“FRB”) STOCK — Our Bank subsidiary is a member of its regional Federal Reserve Bank. FRB stock is carried at cost, classified as a restricted security, and periodically evaluated for impairment based on ultimate recovery of par value. Both cash and stock dividends are reported as income in interest income-other investments on the Consolidated Statements of Operations.
LOAN REVENUE RECOGNITION — Interest on loans is accrued based on the principal amounts outstanding. In general, the accrual of interest income is discontinued when a loan becomes 90 days past due for commercial loans and installment loans and when a loan misses four consecutive payments for mortgage loans and the borrower’s capacity to repay the loan and collateral values appear insufficient for each loan class. However, loans may be placed on non-accrual status regardless of whether or not such loans are considered past due if, in management’s opinion, the borrower is unable to meet payment obligations as they become due or as required by regulatory provisions. All interest accrued but not received for all loans placed on non-accrual is reversed from interest income. Payments on such loans are generally applied to the principal balance until qualifying to be returned to accrual status. A non-accrual loan may be restored to accrual status when interest and principal payments are current and the loan appears otherwise collectible. Delinquency status for all classes in the commercial and installment loan segments is based on the actual number of days past due as required by the contractual terms of the loan agreement while delinquency status for mortgage loan segment classes is based on the number of payments past due.
Certain loan fees and direct loan origination costs are deferred and recognized as an adjustment of yield generally over the contractual life of the related loan. Fees received in connection with loan commitments are deferred until the loan is advanced and are then recognized generally over the contractual life of the loan as an adjustment of yield. Fees on commitments that expire unused are recognized at expiration. Fees received for letters of credit are recognized as revenue over the life of the commitment.
PAYMENT PLAN RECEIVABLE REVENUE RECOGNITION — Payment plan receivables were acquired by Mepco at a discount which was accreted into interest and fees on loans in the Consolidated Statements of Operations over the life of the receivable computed on a level-yield method.
ALLOWANCE FOR LOAN LOSSES — Portfolios are disaggregated into segments for purposes of determining the allowance for loan losses (“AFLL”) which include commercial, mortgage and installment loans. These segments are further disaggregated into classes for purposes of monitoring and assessing credit quality based on certain risk characteristics. Classes within the commercial loan segment include (i) income producing – real estate, (ii) land, land development and construction – real estate and (iii) commercial and industrial. Classes within the mortgage loan segment include (i) 1-4 family, (ii) resort lending, (iii) home equity – 1st lien, (iv) home equity – 2nd lien and beginning in 2015 (v) purchased loans. Classes within the installment loan segment include (i) home equity – 1st lien, (ii) home equity – 2nd lien, (iii) boat lending, (iv) recreational vehicle lending, and (v) other. Commercial loans are subject to adverse market conditions which may impact the borrower’s ability to make repayment on the loan or could cause a decline in the value of the collateral that secures the loan. Mortgage and installment loans are subject to adverse employment conditions in the local economy which could increase default rates. In addition, mortgage loans and real estate based installment loans are subject to adverse market conditions which could cause a decline in the value of collateral that secures the loan. For an analysis of the AFLL by portfolio segment and credit quality information by class, see note #4.
Some loans will not be repaid in full. Therefore, an AFLL is maintained at a level which represents our best estimate of losses incurred. In determining the AFLL and the related provision for loan losses, we consider four principal elements: (i) specific allocations based upon probable losses identified during the review of the loan portfolio, (ii) allocations established for other adversely rated commercial loans, (iii) allocations based principally on historical loan loss experience, and (iv) additional allocations based on subjective factors, including local and general economic business factors and trends, portfolio concentrations and changes in the size and/or the general terms of the loan portfolios.
The first AFLL element (specific allocations) reflects our estimate of probable incurred losses based upon our systematic review of specific loans. These estimates are based upon a number of objective factors, such as payment history, financial condition of the borrower, discounted collateral exposure and discounted cash flow analysis. Impaired commercial, mortgage and installment loans are allocated allowance amounts using this first element. The second AFLL element (other adversely rated commercial loans) reflects the application of our loan rating system. This rating system is similar to those employed by state and federal banking regulators. Commercial loans that are
43
NOTES TO CONSOLIDATED FINANCIAL STATEMENTS — (Continued)
rated below a certain predetermined classification are assigned a loss allocation factor for each loan classification category that is based upon a historical analysis of both the probability of default and the expected loss rate (“loss given default”). The lower the rating assigned to a loan or category, the greater the allocation percentage that is applied. The third AFLL element (historical loss allocations) is determined by assigning allocations to higher rated (“non-watch credit”) commercial loans using a probability of default and loss given default similar to the second AFLL element and to homogenous mortgage and installment loan groups based upon borrower credit score and portfolio segment. For homogenous mortgage and installment loans a probability of default for each homogenous pool is calculated by way of credit score migration. Historical loss data for each homogenous pool coupled with the associated probability of default is utilized to calculate an expected loss allocation rate. The fourth AFLL element (additional allocations based on subjective factors) is based on factors that cannot be associated with a specific credit or loan category and reflects our attempt to reasonably ensure that the overall AFLL appropriately reflects a margin for the imprecision necessarily inherent in the estimates of expected credit losses. We consider a number of subjective factors when determining this fourth element, including local and general economic business factors and trends, portfolio concentrations and changes in the size, mix and the general terms of the overall loan portfolio.
Increases in the AFLL are recorded by a provision for loan losses charged to expense. Although we periodically allocate portions of the AFLL to specific loans and loan portfolios, the entire AFLL is available for incurred losses.
We generally charge-off commercial, homogenous residential mortgage and installment loans (and payment plan receivables prior to the sale of Mepco) when they are deemed uncollectible or reach a predetermined number of days past due based on loan product, industry practice and other factors. Collection efforts may continue and recoveries may occur after a loan is charged against the AFLL.
While we use relevant information to recognize losses on loans, additional provisions for related losses may be necessary based on changes in economic conditions, customer circumstances and other credit risk factors.
A loan is impaired when full payment under the loan terms is not expected. Generally, those loans included in each commercial loan class that are rated substandard, classified as non-performing or were classified as non-performing in the preceding quarter, are evaluated for impairment. Those loans included in each mortgage loan or installment loan class whose terms have been modified and considered a troubled debt restructuring are also impaired. Loans which have been modified resulting in a concession, and which the borrower is experiencing financial difficulties, are considered troubled debt restructurings (“TDR”) and classified as impaired. We measure our investment in an impaired loan based on one of three methods: the loan’s observable market price, the fair value of the collateral or the present value of expected future cash flows discounted at the loan’s effective interest rate. Large groups of smaller balance homogeneous loans, such as those loans included in each installment and mortgage loan class (and each payment plan receivable class prior to the sale of Mepco), are collectively evaluated for impairment and accordingly, they are not separately identified for impairment disclosures. TDR loans are measured at the present value of estimated future cash flows using the loan’s effective interest rate at inception of the loan. If a TDR is considered to be a collateral dependent loan, the loan is reported net, at the fair value of collateral. A loan can be removed from TDR status if it is subsequently restructured and the borrower is no longer experiencing financial difficulties and the newly restructured agreement does not contain any concessions to the borrower. The new agreement must specify market terms, including a contractual interest rate not less than a market interest rate for new debt with similar credit risk characteristics, and other terms no less favorable to us than those we would offer for similar new debt.
PROPERTY AND EQUIPMENT — Property and equipment is stated at cost less accumulated depreciation and amortization. Depreciation and amortization is computed using the straight-line method over the estimated useful lives of the related assets. Buildings are generally depreciated over a period not exceeding 39 years and equipment is generally depreciated over periods not exceeding 7 years. Leasehold improvements are depreciated over the shorter of their estimated useful life or lease period.
BANK OWNED LIFE INSURANCE — We have purchased a group flexible premium non-participating variable life insurance contract on approximately 266 lives (who were salaried employees at the time we purchased the contract) in order to recover the cost of providing certain employee benefits. Bank owned life insurance is recorded at its cash surrender value or the amount that can be currently realized.
44
NOTES TO CONSOLIDATED FINANCIAL STATEMENTS — (Continued)
OTHER REAL ESTATE AND REPOSSESSED ASSETS — Other real estate at the time of acquisition is recorded at fair value, less estimated costs to sell, which becomes the property’s new basis. Fair value is typically determined by a third party appraisal of the property. Any write-downs at date of acquisition are charged to the AFLL. Expense incurred in maintaining other real estate and subsequent write-downs to reflect declines in value and gains or losses on the sale of other real estate are recorded in the Consolidated Statements of Operations. Non-real estate repossessed assets are treated in a similar manner.
OTHER INTANGIBLES — Other intangible assets consist of core deposits. They are initially measured at fair value and then are amortized on both straight-line and accelerated methods over their estimated useful lives, which range from 10 to 15 years.
INCOME TAXES — We employ the asset and liability method of accounting for income taxes. This method establishes deferred tax assets and liabilities for the temporary differences between the financial reporting basis and the tax basis of our assets and liabilities at tax rates expected to be in effect when such amounts are realized or settled. Under this method, the effect of a change in tax rates is recognized in the period that includes the enactment date. The deferred tax asset is subject to a valuation allowance for that portion of the asset for which it is more likely than not that it will not be realized.
A tax position is recognized as a benefit only if it is “more likely than not” that the tax position would be sustained in a tax examination, with a tax examination being presumed to occur. The amount recognized is the largest amount of tax benefit that is greater than 50% likely of being realized on examination.
We recognize interest and/or penalties related to income tax matters in income tax expense.
We file a consolidated federal income tax return. Intercompany tax liabilities are settled as if each subsidiary filed a separate return.
COMMITMENTS TO EXTEND CREDIT AND RELATED FINANCIAL INSTRUMENTS — Financial instruments may include commitments to extend credit and standby letters of credit. Financial instruments involve varying degrees of credit and interest-rate risk in excess of amounts reflected in the Consolidated Statements of Financial Condition. Exposure to credit risk in the event of non-performance by the counterparties to the financial instruments for loan commitments to extend credit and letters of credit is represented by the contractual amounts of those instruments. In general, we use a similar methodology to estimate our liability for these off-balance sheet credit exposures as we do for our AFLL. For commercial related commitments, we estimate liability using our loan rating system and for mortgage and installment commitments we estimate liability principally upon historical loss experience. Our estimated liability for off balance sheet commitments is included in accrued expenses and other liabilities in our Consolidated Statements of Financial Condition and any charge or recovery is recorded in non-interest expense - other in our Consolidated Statements of Operations.
DERIVATIVE FINANCIAL INSTRUMENTS — We record derivatives on our Consolidated Statements of Financial Condition as assets and liabilities measured at their fair value. The accounting for increases and decreases in the value of derivatives depends upon the use of derivatives and whether the derivatives qualify for hedge accounting.
At the inception of the derivative we designate the derivative as one of three types based on our intention and belief as to likely effectiveness as a hedge. These three types are (1) a hedge of the fair value of a recognized asset or liability or of an unrecognized firm commitment (“Fair Value Hedge”), (2) a hedge of a forecasted transaction or the variability of cash flows to be received or paid related to a recognized asset or liability (“Cash Flow Hedge”), or (3) an instrument with no hedging designation. For a Fair Value Hedge, the gain or loss on the derivative, as well as the offsetting loss or gain on the hedged item, are recognized in current earnings as fair values change. For a Cash Flow Hedge, the gain or loss on the derivative is reported in other comprehensive income (loss) and is reclassified into earnings in the same periods during which the hedged transaction affects earnings. We did not have any Fair Value Hedges at December 31, 2017 or 2016. For both types of hedges, changes in the fair value of derivatives that are not highly effective in hedging the changes in fair value or expected cash flows of the hedged item are recognized immediately in current earnings. For instruments with no hedging designation, the gain or loss on the derivative is reported in earnings. These free standing instruments currently consist of (i) mortgage banking related derivatives and include rate-lock loan commitments to fund mortgage loans (interest rate locks) to be sold into the secondary market and mandatory forward commitments for the future delivery of these mortgage loans, (ii) certain pay-fixed and
45
NOTES TO CONSOLIDATED FINANCIAL STATEMENTS — (Continued)
pay-variable interest rate swap agreements related to commercial loan customers and (iii) certain purchased and written options related to a time deposit product. The fair value of rate-lock mortgage loan commitments is based on agency cash window loan pricing for comparable assets and the fair value of mandatory commitments to sell mortgage loans is based on mortgage backed security pricing for comparable assets. We enter into mandatory forward commitments for the future delivery of mortgage loans generally when interest rate locks are entered into in order to hedge the change in interest rates resulting from our commitments to fund the loans. Changes in the fair values of these derivatives are included in net gains on mortgage loans in the Consolidated Statements of Operations. Fair values of the pay-fixed and pay-variable interest rate swap agreements are derived from proprietary models which utilize current market data and are included in net interest income in the Consolidated Statements of Operations. Fair values of the purchased and written options are based on prices of financial instruments with similar characteristics and are included in net interest income in the Consolidated Statements of Operations.
Net cash settlements on derivatives that qualify for hedge accounting are recorded in interest expense in the Consolidated Statements of Operations. Net cash settlements on derivatives that do not qualify for hedge accounting are reported in non-interest income (mortgage banking related derivatives) or net interest income (interest rate swap agreements and options) in the Consolidated Statements of Operations. Cash flows on hedges are classified in the cash flow statement the same as the cash flows of the items being hedged.
We formally document the relationship between derivatives and hedged items, as well as the risk- management objective and the strategy for undertaking hedge transactions, at the inception of the hedging relationship. This documentation includes linking Fair Value or Cash Flow Hedges to specific assets and liabilities on the Consolidated Statements of Financial Condition or to specific firm commitments or forecasted transactions. We also assess, both at the hedge’s inception and on an ongoing basis, whether the derivative instruments that are used are highly effective in offsetting changes in fair values or cash flows of the hedged items. We discontinue hedge accounting when it is determined that the derivative is no longer effective in offsetting changes in the fair value or cash flows of the hedged item, the derivative is settled or terminates, a hedged forecasted transaction is no longer probable, a hedged firm commitment is no longer firm, or treatment of the derivative as a hedge is no longer appropriate or intended.
When hedge accounting is discontinued, subsequent changes in fair value of the derivative are recorded in earnings. When a Fair Value Hedge is discontinued, the hedged asset or liability is no longer adjusted for changes in fair value and the existing basis adjustment is amortized or accreted over the remaining life of the asset or liability. When a Cash Flow Hedge is discontinued but the hedged cash flows or forecasted transactions are still expected to occur, gains or losses that were accumulated in other comprehensive loss are amortized into earnings over the same periods which the hedged transactions will affect earnings.
COMPREHENSIVE INCOME — Comprehensive income consists of net income and unrealized gains and losses, net of tax, on securities available for sale and derivative instruments classified as cash flow hedges.
NET INCOME PER COMMON SHARE — Basic net income per common share is computed by dividing net income by the weighted average number of common shares outstanding during the period and participating share awards. All outstanding unvested share-based payment awards that contain rights to nonforfeitable dividends are considered participating securities for this calculation. For diluted net income per common share, net income is divided by the weighted average number of common shares outstanding during the period plus the assumed exercise of stock options, restricted stock units, performance share units and stock units for a deferred compensation plan for non-employee directors.
SHARE BASED COMPENSATION — Cost is recognized for non-vested share awards issued to employees based on the fair value of these awards at the date of grant. A simulation analysis which considers potential outcomes for a large number of independent scenarios is utilized to estimate the fair value of performance share units and the market price of our common stock at the date of grant is used for other non-vested share awards. Cost is recognized over the required service period, generally defined as the vesting period. Cost is also recognized for stock issued to non-employee directors. These shares vest immediately and cost is recognized during the period they are issued.
COMMON STOCK — At December 31, 2017, 0.1 million shares of common stock were reserved for issuance under the dividend reinvestment plan and 0.5 million shares of common stock were reserved for issuance under our long-term incentive plans.
46
NOTES TO CONSOLIDATED FINANCIAL STATEMENTS — (Continued)
RECLASSIFICATION — Certain amounts in the 2016 and 2015 consolidated financial statements have been reclassified to conform to the 2017 presentation.
ADOPTION OF NEW ACCOUNTING STANDARDS — In March 2017, the FASB issued Accounting Standards Update (“ASU”) 2017-08, “Receivables-Nonrefundable Fees and Other Costs (Subtopic 310-20) Premium Amortization on Purchased Callable Debt Securities” (“ASU 2017-08”). This ASU shortens the amortization period for certain callable debt securities held at a premium. Specifically, the amendments require the premium to be amortized to the earliest call date. The amendments do not require an accounting change for securities held at a discount; the discount continues to be accreted to maturity. This amended guidance is effective for us on January 1, 2019, with early adoption permitted. We adopted this amended guidance during the first quarter of 2017 using a modified retrospective approach. The impact of this adoption was to adjust our January 1, 2017 Consolidated Statement of Financial Position to reflect cumulative effect adjustments as summarized in the table below. The adjustments below reflect the recording of $0.46 million ($0.30 million, net of tax) of additional premium amortization on securities available for sale and a $0.30 million decrease in accumulated other comprehensive loss to reflect the decrease in after tax unrealized losses on securities available for sale as of January 1, 2017 as a result of adopting this amended guidance. After January 1, 2017, premium amortization on certain callable debt securities is now amortized to the first call date.
The impact of the adoption of the fair value method of accounting for our capitalized mortgage loan servicing rights and the adoption of ASU 2017-08 follows:
|
|
January 1,
2017 Originally Presented |
Cumulative
Retrospective Adjustments |
January 1,
2017 Adjusted |
||||||
|
|
(In thousands)
|
||||||||
|
Deferred tax assets, net
|
$
|
32,818
|
|
$
|
(190
|
)(1)
|
$
|
32,628
|
|
|
Capitalized mortgage loan servicing rights
|
$
|
13,671
|
|
$
|
542
|
(1)
|
$
|
14,213
|
|
|
Total assets
|
$
|
2,548,950
|
|
$
|
352
|
|
$
|
2,549,302
|
|
|
Accumulated deficit
|
$
|
(65,657
|
)
|
$
|
352
|
(1)
|
|
|
|
|
|
|
|
|
$
|
(300
|
)(2)
|
$
|
(65,605
|
)
|
|
Accumulated other comprehensive loss
|
$
|
(9,108
|
)
|
$
|
300
|
(2)
|
$
|
(8,808
|
)
|
|
Total Shareholders’ Equity
|
$
|
248,980
|
|
$
|
352
|
|
$
|
249,332
|
|
|
Total Liabilities and Shareholders’ Equity
|
$
|
2,548,950
|
|
$
|
352
|
|
$
|
2,549,302
|
|
| (1) | Represents adjustment to capitalized mortgage loan servicing rights, deferred tax assets, net, and accumulated deficit to reflect the adoption of the fair value method of accounting for our capitalized mortgage loan servicing rights. |
| (2) | Represents adjustment to accumulated deficit and accumulated other comprehensive loss to reflect the adoption of ASU 2017-08. |
In May 2014, the FASB issued ASU 2014-09, “Revenue from Contracts with Customers (Topic 606)”. This ASU supersedes and replaces nearly all existing revenue recognition guidance, including industry-specific guidance, establishes a new control-based revenue recognition model, changes the basis for deciding when revenue is recognized over time or at a point in time, provides new and more guidance on specific topics and expands and improves disclosures about revenue. In addition, this ASU specifies the accounting for some costs to obtain or fulfill a contract with a customer. This amended guidance was effective for us on January 1, 2018, and did not have a material impact on our consolidated operating results or financial condition. We adopted this ASU using the modified retrospective approach with no material impact to our accumulated deficit at January 1, 2018. Financial instruments for the most part and related contractual rights and obligations which are the sources of the majority of our operating
47
NOTES TO CONSOLIDATED FINANCIAL STATEMENTS — (Continued)
revenue are excluded from the scope of this amended guidance. In addition, for those operating revenue streams that are included in the scope of this amended guidance, based upon our review of these sources of income they are not expected to be materially impacted by this amended guidance.
In January 2016, the FASB issued ASU 2016-01, “Financial Instruments – Overall (Subtopic 825-10) – Recognition and Measurement of Financial Assets and Financial Liabilities”. This ASU amends existing guidance related to the accounting for certain financial assets and liabilities. These amendments, among other things, requires equity investments (except those accounted for under the equity method of accounting, or those that result in consolidation of the investee) to be measured at fair value with changes in fair value recognized in net income, requires public business entities to use the exit price notion when measuring the fair value of financial instruments for disclosure purposes, requires separate presentation of financial assets and financial liabilities by measurement category and form of financial asset and eliminates the requirement for public business entities to disclose the method(s) and significant assumptions used to estimate the fair value that is required to be disclosed for financial instruments measured at amortized cost. This amended guidance is effective for us on January 1, 2018. We have reviewed the types of financial instruments impacted by this amended guidance, including certain equity investments and liabilities measured under the fair value election, and have determined that we do not currently own any such instruments. The balance of this amended guidance is expected to impact certain disclosure items but is not expected to have any impact on our consolidated operating results or financial condition.
In February 2016, the FASB issued ASU 2016-02, “Leases (Topic 842)”. This ASU amends existing guidance related to the accounting for leases. These amendments, among other things, requires lessees to account for most leases on the balance sheet while recognizing expense on the income statement in a manner similar to existing guidance. For lessors the guidance modifies the classification criteria and the accounting for sales-type and direct finance leases. This amended guidance is effective for us on January 1, 2019 and is not expected to have a material impact on our consolidated operating results or financial condition. Based on a review of our operating leases that we currently have in place (see note #18) we do not expect a material change in the recognition, measurement and presentation of lease expense or impact on cash flow. While the primary impact will be the recognition of certain operating leases on our Consolidated Statements of Financial Condition, this impact is not expected to be material.
In June 2016, the FASB issued ASU 2016-13, “Financial Instruments — Credit Losses (Topic 326), Measurement of Credit Losses on Financial Instruments”. This ASU significantly changes how entities will measure credit losses for most financial assets and certain other instruments that are not measured at fair value through net income. This ASU will replace today’s “incurred loss” approach with an “expected loss” model for instruments measured at amortized cost. For securities available for sale, allowances will be recorded rather than reducing the carrying amount as is done under the current other-than-temporary impairment model. This ASU also simplifies the accounting model for purchased credit-impaired debt securities and loans. This amended guidance is effective for us on January 1, 2020. We began evaluating this ASU in 2016 and have formed a committee that includes personnel from various areas of the Bank that meets regularly to discuss the implementation of the ASU. We are currently in the process of gathering data and reviewing loss methodologies and have engaged third party resources that will assist us in the implementation of this ASU. While we have not yet determined what the impact will be on our consolidated operating results or financial condition by the nature of the implementation of an expected loss model compared to an incurred loss approach, we would expect our allowance for loan losses to increase under this ASU.
In January 2017, the FASB issued ASU 2017-01, “Business Combinations (Topic 805), Clarifying the Definition of a Business”. This new ASU clarifies the definition of a business with the objective of adding guidance to assist entities with evaluating whether transactions should be accounted for as acquisitions (or disposals) of assets or businesses which distinction determines whether goodwill is recorded or not. This amended guidance was effective for us on January 1, 2018, and did not have a material impact on our consolidated operating results or financial condition.
In January 2017, the FASB issued ASU 2017-4, “Intangibles – Goodwill and Other (Topic 350), Simplifying the Test for Goodwill Impairment”. This new ASU amends the requirement that entities compare the implied fair value of goodwill with its carrying amount as part of step 2 of the goodwill impairment test. As a result, entities should perform their annual or interim goodwill impairment test by comparing the fair value of a reporting unit with its carrying amount and recognize an impairment if the carrying amount exceeds the reporting unit’s fair value. This
48
NOTES TO CONSOLIDATED FINANCIAL STATEMENTS — (Continued)
amended guidance is effective for us on January 1, 2020 with early application permitted. Due to our pending acquisition (see note #27) and expectations this ASU will be relevant to us in 2018 we elected to adopt this amended guidance as of January 1, 2018. The adoption of this ASU did not have a material impact on our consolidated operating results or financial condition.
In August 2017, the FASB issued ASU 2017-12, “Derivatives and Hedging (Topic 815), Targeted Improvements to Accounting for Hedging Activities”. This new ASU amends the hedge accounting model in Topic 815 to enable entities to better portray the economics of their risk management activities in the financial statements and enhance the transparency and understandability of hedge results. The amendments expand an entity’s ability to hedge nonfinancial and financial risk components and reduce complexity in fair value hedges of interest rate risk. The guidance eliminates the requirement to separately measure and report hedge ineffectiveness and generally requires the entire change in the fair value of a hedging instrument to be presented in the same income statement line as the hedged item. The guidance also eases certain documentation and assessment requirements and modifies the accounting for components excluded from the assessment of hedge effectiveness. This amended guidance is effective for us on January 1, 2019, and given our current level of derivatives designated as hedges is not expected to have a material impact on our consolidated operating results or financial condition.
In February 2018, the FASB issued ASU 2018-02, “Income Statement – Reporting Comprehensive Income (Topic 220), Reclassification of Certain Tax Effects from Accumulated Other Comprehensive Income”. This new ASU allows a reclassification from accumulated other comprehensive income to retained earnings for stranded tax effects resulting from the Tax Cuts and Jobs Act. As a result, this amended guidance eliminate the stranded tax effects resulting from the Tax Cuts and Jobs Act and will improve the usefulness of information reported to financial statement users. This amended guidance is effective for us on January 1, 2019, with early application permitted in any period for which financial statements have not yet been issued. We elected to adopt this amended guidance during the fourth quarter of 2017 and it resulted in a $0.04 million reclassification between accumulated other comprehensive loss and accumulated deficit.
NOTE 2 – RESTRICTIONS ON CASH AND DUE FROM BANKS
Our Bank is required to maintain reserve balances in the form of vault cash and non-interest earning balances with the FRB. The average reserve balances to be maintained during 2017 and 2016 were $5.2 million and $4.0 million, respectively. We do not maintain compensating balances with correspondent banks. We are also required to maintain reserve balances related primarily to our merchant payment processing operations and for certain investment security transactions. These balances are held at unrelated financial institutions and totaled $0.7 million and $2.4 million at December 31, 2017 and 2016, respectively.
49
NOTES TO CONSOLIDATED FINANCIAL STATEMENTS — (Continued)
NOTE 3 – SECURITIES
Securities available for sale consist of the following at December 31:
|
|
Amortized
Cost |
Unrealized
|
|
|||||||||
|
|
Gains
|
Losses
|
Fair Value
|
|||||||||
|
|
(In thousands)
|
|||||||||||
|
2017
|
|
|
|
|
|
|
|
|
|
|
|
|
|
U.S. Treasury
|
$
|
898
|
|
$
|
—
|
|
$
|
—
|
|
$
|
898
|
|
|
U.S. agency
|
|
25,667
|
|
|
82
|
|
|
67
|
|
|
25,682
|
|
|
U.S. agency residential mortgage-backed
|
|
137,785
|
|
|
1,116
|
|
|
983
|
|
|
137,918
|
|
|
U.S. agency commercial mortgage-backed
|
|
9,894
|
|
|
36
|
|
|
170
|
|
|
9,760
|
|
|
Private label mortgage-backed
|
|
29,011
|
|
|
428
|
|
|
330
|
|
|
29,109
|
|
|
Other asset backed
|
|
93,811
|
|
|
202
|
|
|
115
|
|
|
93,898
|
|
|
Obligations of states and political subdivisions
|
|
174,073
|
|
|
755
|
|
|
1,883
|
|
|
172,945
|
|
|
Corporate
|
|
47,365
|
|
|
578
|
|
|
90
|
|
|
47,853
|
|
|
Trust preferred
|
|
2,929
|
|
|
—
|
|
|
127
|
|
|
2,802
|
|
|
Foreign government
|
|
2,087
|
|
|
—
|
|
|
27
|
|
|
2,060
|
|
|
Total
|
$
|
523,520
|
|
$
|
3,197
|
|
$
|
3,792
|
|
$
|
522,925
|
|
|
|
|
|
|
|
|
|
|
|
|
|
|
|
|
2016
|
|
|
|
|
|
|
|
|
|
|
|
|
|
U.S. agency
|
$
|
28,909
|
|
$
|
159
|
|
$
|
80
|
|
$
|
28,988
|
|
|
U.S. agency residential mortgage-backed
|
|
156,053
|
|
|
1,173
|
|
|
937
|
|
|
156,289
|
|
|
U.S. agency commercial mortgage-backed
|
|
12,799
|
|
|
28
|
|
|
195
|
|
|
12,632
|
|
|
Private label mortgage-backed
|
|
35,035
|
|
|
216
|
|
|
524
|
|
|
34,727
|
|
|
Other asset backed
|
|
146,829
|
|
|
271
|
|
|
391
|
|
|
146,709
|
|
|
Obligations of states and political subdivisions
|
|
175,180
|
|
|
478
|
|
|
4,759
|
|
|
170,899
|
|
|
Corporate
|
|
56,356
|
|
|
223
|
|
|
399
|
|
|
56,180
|
|
|
Trust preferred
|
|
2,922
|
|
|
—
|
|
|
343
|
|
|
2,579
|
|
|
Foreign government
|
|
1,626
|
|
|
—
|
|
|
13
|
|
|
1,613
|
|
|
Total
|
$
|
615,709
|
|
$
|
2,548
|
|
$
|
7,641
|
|
$
|
610,616
|
|
We adopted ASU 2017-08 during the first quarter of 2017 using a modified retrospective approach. As a result, the amortized cost of securities as of January 1, 2017 was adjusted lower by $0.46 million (see note #1).
Total OTTI recognized in accumulated other comprehensive loss for securities available for sale was zero at both December 31, 2017 and 2016, respectively.
Our investments’ gross unrealized losses and fair values aggregated by investment type and length of time that individual securities have been at a continuous unrealized loss position, at December 31 follows:
|
|
Less Than Twelve Months
|
Twelve Months or More
|
Total
|
|||||||||||||||
|
|
Fair Value
|
Unrealized
Losses |
Fair Value
|
Unrealized
Losses |
Fair Value
|
Unrealized
Losses |
||||||||||||
|
|
(In thousands)
|
|||||||||||||||||
|
2017
|
|
|
|
|
|
|
|
|
|
|
|
|
|
|
|
|
|
|
|
U.S. agency
|
$
|
5,466
|
|
$
|
26
|
|
$
|
5,735
|
|
$
|
41
|
|
$
|
11,201
|
|
$
|
67
|
|
|
U.S. agency residential mortgage-backed
|
|
22,198
|
|
|
229
|
|
|
40,698
|
|
|
754
|
|
|
62,896
|
|
|
983
|
|
|
U.S. agency commercial mortgage-backed
|
|
2,181
|
|
|
34
|
|
|
3,994
|
|
|
136
|
|
|
6,175
|
|
|
170
|
|
|
Private label mortgage-backed
|
|
11,390
|
|
|
92
|
|
|
4,396
|
|
|
238
|
|
|
15,786
|
|
|
330
|
|
|
Other asset backed
|
|
20,352
|
|
|
40
|
|
|
16,648
|
|
|
75
|
|
|
37,000
|
|
|
115
|
|
|
Obligations of states and political subdivisions
|
|
76,574
|
|
|
936
|
|
|
28,246
|
|
|
947
|
|
|
104,820
|
|
|
1,883
|
|
|
Corporate
|
|
14,440
|
|
|
33
|
|
|
3,943
|
|
|
57
|
|
|
18,383
|
|
|
90
|
|
|
Trust preferred
|
|
—
|
|
|
—
|
|
|
2,802
|
|
|
127
|
|
|
2,802
|
|
|
127
|
|
|
Foreign government
|
|
489
|
|
|
10
|
|
|
1,571
|
|
|
17
|
|
|
2,060
|
|
|
27
|
|
|
Total
|
$
|
153,090
|
|
$
|
1,400
|
|
$
|
108,033
|
|
$
|
2,392
|
|
$
|
261,123
|
|
$
|
3,792
|
|
50
NOTES TO CONSOLIDATED FINANCIAL STATEMENTS — (Continued)
|
|
Less Than Twelve Months
|
Twelve Months or More
|
Total
|
|||||||||||||||
|
|
Fair Value
|
Unrealized
Losses |
Fair Value
|
Unrealized
Losses |
Fair Value
|
Unrealized
Losses |
||||||||||||
|
|
(In thousands)
|
|||||||||||||||||
|
2016
|
|
|
|
|
|
|
|
|
|
|
|
|
|
|
|
|
|
|
|
U.S. agency
|
$
|
4,179
|
|
$
|
41
|
|
$
|
8,217
|
|
$
|
39
|
|
$
|
12,396
|
|
$
|
80
|
|
|
U.S. agency residential mortgage-backed
|
|
62,524
|
|
|
732
|
|
|
20,857
|
|
|
205
|
|
|
83,381
|
|
|
937
|
|
|
U.S. agency commercial mortgage-backed
|
|
6,079
|
|
|
194
|
|
|
143
|
|
|
1
|
|
|
6,222
|
|
|
195
|
|
|
Private label mortgage-backed
|
|
20,545
|
|
|
281
|
|
|
1,413
|
|
|
243
|
|
|
21,958
|
|
|
524
|
|
|
Other asset backed
|
|
52,958
|
|
|
172
|
|
|
17,763
|
|
|
219
|
|
|
70,721
|
|
|
391
|
|
|
Obligations of states and political subdivisions
|
|
113,078
|
|
|
4,014
|
|
|
14,623
|
|
|
745
|
|
|
127,701
|
|
|
4,759
|
|
|
Corporate
|
|
25,546
|
|
|
292
|
|
|
2,810
|
|
|
107
|
|
|
28,356
|
|
|
399
|
|
|
Trust preferred
|
|
—
|
|
|
—
|
|
|
2,579
|
|
|
343
|
|
|
2,579
|
|
|
343
|
|
|
Foreign government
|
|
1,613
|
|
|
13
|
|
|
—
|
|
|
—
|
|
|
1,613
|
|
|
13
|
|
|
Total
|
$
|
286,522
|
|
$
|
5,739
|
|
$
|
68,405
|
|
$
|
1,902
|
|
$
|
354,927
|
|
$
|
7,641
|
|
Our portfolio of securities available for sale is reviewed quarterly for impairment in value. In performing this review, management considers (1) the length of time and extent that fair value has been less than cost, (2) the financial condition and near term prospects of the issuer, (3) the impact of changes in market interest rates on the market value of the security and (4) an assessment of whether we intend to sell, or it is more likely than not that we will be required to sell a security in an unrealized loss position before recovery of its amortized cost basis. For securities that do not meet the aforementioned recovery criteria, the amount of impairment recognized in earnings is limited to the amount related to credit losses, while impairment related to other factors is recognized in other comprehensive income (loss).
U.S. agency, U.S. agency residential mortgage-backed securities and U.S. agency commercial mortgage backed securities — at December 31, 2017, we had 34 U.S. agency, 128 U.S. agency residential mortgage-backed and 12 U.S. agency commercial mortgage-backed securities whose fair market value is less than amortized cost. The unrealized losses are largely attributed to increases in interest rates since acquisition and widening spreads to Treasury bonds. As management does not intend to liquidate these securities and it is more likely than not that we will not be required to sell these securities prior to recovery of these unrealized losses, no declines are deemed to be other than temporary.
Private label mortgage backed securities — at December 31, 2017, we had 20 of this type of security whose fair value is less than amortized cost. Unrealized losses are primarily due to credit spread widening and increases in interest rates since their acquisition.
Six private label mortgage-backed securities (including the three securities discussed further below) were reviewed for other than temporary impairment (“OTTI”) utilizing a cash flow projection. The cash flow analysis forecasts cash flow from the underlying loans in each transaction and then applies these cash flows to the bonds in the securitization. Our cash flow analysis forecasts complete recovery of our cost basis for all of these securities whose fair value is less than amortized cost. See further discussion below.
As management does not intend to liquidate these securities and it is more likely than not that we will not be required to sell these securities prior to recovery of these unrealized losses, no other declines discussed above are deemed to be other than temporary.
Other asset backed — at December 31, 2017, we had 68 other asset backed securities whose fair value is less than amortized cost. The unrealized losses are primarily due to credit spread widening and increases in interest rates since acquisition. As management does not intend to liquidate these securities and it is more likely than not that we will not be required to sell these securities prior to recovery of these unrealized losses, no declines are deemed to be other than temporary.
Obligations of states and political subdivisions — at December 31, 2017, we had 334 municipal securities whose fair value is less than amortized cost. The unrealized losses are primarily due to wider benchmark pricing spreads and
51
NOTES TO CONSOLIDATED FINANCIAL STATEMENTS — (Continued)
increases in interest rates since acquisition. Tax exempt securities have been negatively impacted by lower federal tax rates signed into law in December, 2017. As management does not intend to liquidate these securities and it is more likely than not that we will not be required to sell these securities prior to recovery of these unrealized losses, no declines are deemed to be other than temporary.
Corporate — at December 31, 2017, we had 18 corporate securities whose fair value is less than amortized cost. The unrealized losses are primarily due to credit spread widening and increases in interest rates since acquisition. As management does not intend to liquidate these securities and it is more likely than not that we will not be required to sell these securities prior to recovery of these unrealized losses, no declines are deemed to be other than temporary.
Trust preferred securities — at December 31, 2017, we had three trust preferred securities whose fair value is less than amortized cost. All of our trust preferred securities are single issue securities issued by a trust subsidiary of a bank holding company. The pricing of trust preferred securities has suffered from credit spread widening.
Two of the three securities are rated by two major rating agencies as investment grade while the other one is non-rated. The non-rated issue is a relatively small bank and was never rated. The issuer of this non-rated trust preferred security, which had a total amortized cost of $1.0 million and total fair value of $0.9 million as of December 31, 2017, continues to have satisfactory credit metrics and make interest payments.
The following table breaks out our trust preferred securities in further detail as of December 31:
|
|
2017
|
2016
|
||||||||||
|
|
Fair
Value |
Net
Unrealized Loss |
Fair
Value |
Net
Unrealized Loss |
||||||||
|
|
(In thousands)
|
|||||||||||
|
Trust preferred securities
|
|
|
|
|
|
|
|
|
|
|
|
|
|
Rated issues
|
$
|
1,882
|
|
$
|
(69
|
)
|
$
|
1,800
|
|
$
|
(123
|
)
|
|
Unrated issues
|
|
920
|
|
|
(58
|
)
|
|
779
|
|
|
(220
|
)
|
As management does not intend to liquidate these securities and it is more likely than not that we will not be required to sell these securities prior to recovery of these unrealized losses, no declines are deemed to be other than temporary.
Foreign government — at December 31, 2017, we had two foreign government securities whose fair value is less than amortized cost. The unrealized losses are primarily due to increases in interest rates since acquisition. As management does not intend to liquidate these securities and it is more likely than not that we will not be required to sell these securities prior to recovery of these unrealized losses, no declines are deemed to be other than temporary.
We recorded zero credit related OTTI charges in the Consolidated Statements of Operations on securities available for sale during 2017, 2016, and 2015.
At December 31, 2017, three private label mortgage-backed securities had credit related OTTI and are summarized as follows:
|
|
Senior
Security |
Super
Senior Security |
Senior
Support Security |
Total
|
||||||||
|
|
(In thousands)
|
|||||||||||
|
As of December 31, 2017
|
|
|
|
|
|
|
|
|
|
|
|
|
|
Fair value
|
$
|
1,033
|
|
$
|
966
|
|
$
|
61
|
|
$
|
2,060
|
|
|
Amortized cost
|
|
891
|
|
|
800
|
|
|
—
|
|
|
1,691
|
|
|
Non-credit unrealized loss
|
|
—
|
|
|
—
|
|
|
—
|
|
|
—
|
|
|
Unrealized gain
|
|
142
|
|
|
166
|
|
|
61
|
|
|
369
|
|
|
Cumulative credit related OTTI
|
|
757
|
|
|
457
|
|
|
380
|
|
|
1,594
|
|
52
NOTES TO CONSOLIDATED FINANCIAL STATEMENTS — (Continued)
Each of these securities is receiving principal and interest payments similar to principal reductions in the underlying collateral. All three of these securities have unrealized gains at December 31, 2017. The original amortized cost for each of these securities has been permanently adjusted downward for previously recorded credit related OTTI. The unrealized loss (based on original amortized cost) for these securities is now less than previously recorded credit related OTTI amounts.
A roll forward of credit losses recognized in earnings on securities available for sale for the years ending December 31 follow:
|
|
2017
|
2016
|
2015
|
||||||
|
|
(In thousands)
|
||||||||
|
Balance at beginning of year
|
$
|
1,594
|
|
$
|
1,594
|
|
$
|
1,844
|
|
|
Additions to credit losses on securities for which no previous OTTI was recognized
|
|
—
|
|
|
—
|
|
|
—
|
|
|
Increases to credit losses on securities for which OTTI was previously recognized
|
|
—
|
|
|
—
|
|
|
—
|
|
|
Decrease to credit losses on securities for which OTTI was previously recognized as a result of disposal
|
|
—
|
|
|
—
|
|
|
(250
|
)
|
|
Total
|
$
|
1,594
|
|
$
|
1,594
|
|
$
|
1,594
|
|
The amortized cost and fair value of securities available for sale at December 31, 2017, by contractual maturity, follow:
|
|
Amortized
Cost |
Fair
Value |
||||
|
|
(In thousands)
|
|||||
|
Maturing within one year
|
$
|
31,572
|
|
$
|
31,589
|
|
|
Maturing after one year but within five years
|
|
93,867
|
|
|
93,687
|
|
|
Maturing after five years but within ten years
|
|
73,967
|
|
|
74,150
|
|
|
Maturing after ten years
|
|
53,613
|
|
|
52,814
|
|
|
|
|
253,019
|
|
|
252,240
|
|
|
U.S. agency residential mortgage-backed
|
|
137,785
|
|
|
137,918
|
|
|
U.S. agency commercial mortgage-backed
|
|
9,894
|
|
|
9,760
|
|
|
Private label mortgage-backed
|
|
29,011
|
|
|
29,109
|
|
|
Other asset backed
|
|
93,811
|
|
|
93,898
|
|
|
Total
|
$
|
523,520
|
|
$
|
522,925
|
|
The actual maturity may differ from the contractual maturity because issuers may have the right to call or prepay obligations with or without call or prepayment penalties.
A summary of proceeds from the sale of securities available for sale and gains and losses for the years ended December 31 follow:
|
|
Proceeds
|
Realized
Gains |
Losses
|
||||||
|
|
(In thousands)
|
||||||||
|
2017
|
$
|
17,308
|
|
$
|
218
|
|
$
|
3
|
|
|
2016
|
|
64,103
|
|
|
354
|
|
|
53
|
|
|
2015
|
|
12,037
|
|
|
75
|
|
|
—
|
|
53
NOTES TO CONSOLIDATED FINANCIAL STATEMENTS — (Continued)
During 2017, 2016 and 2015, our trading securities consisted of various preferred stocks. During each of those years, we recognized gains (losses) on trading securities of $0.05 million, $0.26 million and $(0.06) million, respectively, that are included in net gains on securities in the Consolidated Statements of Operations. All of these amounts relate to gains (losses) recognized on trading securities still held at December 31, 2017 and 2016.
Securities available for sale with a book value of $0.9 million and $2.4 million at December 31, 2017 and 2016, respectively, were pledged to secure borrowings, derivatives, public deposits and for other purposes as required by law. There were no investment obligations of state and political subdivisions that were payable from or secured by the same source of revenue or taxing authority that exceeded 10% of consolidated shareholders’ equity at December 31, 2017 or 2016.
NOTE 4 – LOANS AND PAYMENT PLAN RECEIVABLES
Our loan portfolios at December 31 follow:
|
|
2017
|
2016
|
||||
|
|
(In thousands)
|
|||||
|
Real estate (1)
|
|
|
|
|
|
|
|
Residential first mortgages
|
$
|
672,592
|
|
$
|
453,348
|
|
|
Residential home equity and other junior mortgages
|
|
136,560
|
|
|
105,550
|
|
|
Construction and land development
|
|
143,188
|
|
|
77,287
|
|
|
Other (2)
|
|
538,880
|
|
|
525,748
|
|
|
Consumer
|
|
291,091
|
|
|
234,632
|
|
|
Commercial
|
|
231,786
|
|
|
206,607
|
|
|
Agricultural
|
|
4,720
|
|
|
5,076
|
|
|
Total loans
|
$
|
2,018,817
|
|
$
|
1,608,248
|
|
| (1) | Includes both residential and non-residential commercial loans secured by real estate. |
| (2) | Includes loans secured by multi-family residential and non-farm, non-residential property. |
Loans include net deferred loan costs of $9.3 million and $4.1 million at December 31, 2017 and 2016, respectively.
54
NOTES TO CONSOLIDATED FINANCIAL STATEMENTS — (Continued)
In August 2016 and December 2015, we purchased $15.0 million and $32.6 million, respectively of single-family residential fixed rate jumbo mortgage loans from two separate Michigan-based financial institutions. These mortgage loans were all on properties located in Michigan, had weighted average interest rates (after a 0.25% servicing fee) of 3.65% and 3.94%, respectively and weighted average remaining contractual maturities of 332 months and 344 months, respectively. We did not purchase any loans during 2017.
An analysis of the allowance for loan losses by portfolio segment for the years ended December 31 follows:
|
|
Commercial
|
Mortgage
|
Installment
|
Payment
Plan Receivables |
Subjective
Allocation |
Total
|
||||||||||||
|
|
(In thousands)
|
|||||||||||||||||
|
2017
|
|
|
|
|
|
|
|
|
|
|
|
|
|
|
|
|
|
|
|
Balance at beginning of period
|
$
|
4,880
|
|
$
|
8,681
|
|
$
|
1,011
|
|
$
|
—
|
|
$
|
5,662
|
|
$
|
20,234
|
|
|
Additions (deductions)
|
|
|
|
|
|
|
|
|
|
|
|
|
|
|
|
|
|
|
|
Provision for loan losses
|
|
(327
|
)
|
|
(567
|
)
|
|
360
|
|
|
—
|
|
|
1,733
|
|
|
1,199
|
|
|
Recoveries credited to allowance
|
|
1,497
|
|
|
1,741
|
|
|
967
|
|
|
—
|
|
|
—
|
|
|
4,205
|
|
|
Loans charged against the allowance
|
|
(455
|
)
|
|
(1,122
|
)
|
|
(1,474
|
)
|
|
—
|
|
|
—
|
|
|
(3,051
|
)
|
|
Balance at end of period
|
$
|
5,595
|
|
$
|
8,733
|
|
$
|
864
|
|
$
|
—
|
|
$
|
7,395
|
|
$
|
22,587
|
|
|
|
|
|
|
|
|
|
|
|
|
|
|
|
|
|
|
|
|
|
|
2016
|
|
|
|
|
|
|
|
|
|
|
|
|
|
|
|
|
|
|
|
Balance at beginning of period
|
$
|
5,670
|
|
$
|
10,391
|
|
$
|
1,181
|
|
$
|
56
|
|
$
|
5,272
|
|
$
|
22,570
|
|
|
Additions (deductions)
|
|
|
|
|
|
|
|
|
|
|
|
|
|
|
|
|
|
|
|
Provision for loan losses
|
|
(1,945
|
)
|
|
(158
|
)
|
|
401
|
|
|
(4
|
)
|
|
397
|
|
|
(1,309
|
)
|
|
Recoveries credited to allowance
|
|
2,472
|
|
|
1,047
|
|
|
1,100
|
|
|
—
|
|
|
—
|
|
|
4,619
|
|
|
Loans charged against the allowance
|
|
(1,317
|
)
|
|
(2,599
|
)
|
|
(1,671
|
)
|
|
—
|
|
|
—
|
|
|
(5,587
|
)
|
|
Reclassification to loans held for sale
|
|
—
|
|
|
—
|
|
|
—
|
|
|
(52
|
)
|
|
(7
|
)
|
|
(59
|
)
|
|
Balance at end of period
|
$
|
4,880
|
|
$
|
8,681
|
|
$
|
1,011
|
|
$
|
—
|
|
$
|
5,662
|
|
$
|
20,234
|
|
|
|
|
|
|
|
|
|
|
|
|
|
|
|
|
|
|
|
|
|
|
2015
|
|
|
|
|
|
|
|
|
|
|
|
|
|
|
|
|
|
|
|
Balance at beginning of period
|
$
|
5,445
|
|
$
|
13,444
|
|
$
|
1,814
|
|
$
|
64
|
|
$
|
5,223
|
|
$
|
25,990
|
|
|
Additions (deductions)
|
||||||||||||||||||
|
Provision for loan losses
|
|
(737
|
)
|
|
(1,744
|
)
|
|
(274
|
)
|
|
(8
|
)
|
|
49
|
|
|
(2,714
|
)
|
|
Recoveries credited to allowance
|
|
2,656
|
|
|
1,258
|
|
|
1,108
|
|
|
—
|
|
|
—
|
|
|
5,022
|
|
|
Loans charged against the allowance
|
|
(1,694
|
)
|
|
(2,567
|
)
|
|
(1,467
|
)
|
|
—
|
|
|
—
|
|
|
(5,728
|
)
|
|
Balance at end of period
|
$
|
5,670
|
|
$
|
10,391
|
|
$
|
1,181
|
|
$
|
56
|
|
$
|
5,272
|
|
$
|
22,570
|
|
55
NOTES TO CONSOLIDATED FINANCIAL STATEMENTS — (Continued)
Allowance for loan losses and recorded investment in loans by portfolio segment follows:
|
|
Commercial
|
Mortgage
|
Installment
|
Subjective
Allocation |
Total
|
||||||||||
|
|
(In thousands)
|
||||||||||||||
|
2017
|
|
|
|
|
|
|
|
|
|
|
|
|
|
|
|
|
Allowance for loan losses:
|
|
|
|
|
|
|
|
|
|
|
|
|
|
|
|
|
Individually evaluated for impairment
|
$
|
837
|
|
$
|
5,725
|
|
$
|
277
|
|
$
|
—
|
|
$
|
6,839
|
|
|
Collectively evaluated for impairment
|
|
4,758
|
|
|
3,008
|
|
|
587
|
|
|
7,395
|
|
|
15,748
|
|
|
Total ending allowance balance
|
$
|
5,595
|
|
$
|
8,733
|
|
$
|
864
|
|
$
|
7,395
|
|
$
|
22,587
|
|
|
|
|
|
|
|
|
|
|
|
|
|
|
|
|
|
|
|
Loans
|
|
|
|
|
|
|
|
|
|
|
|
|
|
|
|
|
Individually evaluated for impairment
|
$
|
8,420
|
|
$
|
53,179
|
|
$
|
3,945
|
|
|
|
|
$
|
65,544
|
|
|
Collectively evaluated for impairment
|
|
847,140
|
|
|
799,629
|
|
|
313,005
|
|
|
|
|
|
1,959,774
|
|
|
Total loans recorded investment
|
|
855,560
|
|
|
852,808
|
|
|
316,950
|
|
|
|
|
|
2,025,318
|
|
|
Accrued interest included in recorded investment
|
|
2,300
|
|
|
3,278
|
|
|
923
|
|
|
|
|
|
6,501
|
|
|
Total loans
|
$
|
853,260
|
|
$
|
849,530
|
|
$
|
316,027
|
|
|
|
|
$
|
2,018,817
|
|
|
|
|
|
|
|
|
|
|
|
|
|
|
|
|
|
|
|
2016
|
|
|
|
|
|
|
|
|
|
|
|
|
|
|
|
|
Allowance for loan losses:
|
|
|
|
|
|
|
|
|
|
|
|
|
|
|
|
|
Individually evaluated for impairment
|
$
|
2,244
|
|
$
|
6,579
|
|
$
|
329
|
|
$
|
—
|
|
$
|
9,152
|
|
|
Collectively evaluated for impairment
|
|
2,636
|
|
|
2,102
|
|
|
682
|
|
|
5,662
|
|
|
11,082
|
|
|
Total ending allowance balance
|
$
|
4,880
|
|
$
|
8,681
|
|
$
|
1,011
|
|
$
|
5,662
|
|
$
|
20,234
|
|
|
|
|
|
|
|
|
|
|
|
|
|
|
|
|
|
|
|
Loans
|
|
|
|
|
|
|
|
|
|
|
|
|
|
|
|
|
Individually evaluated for impairment
|
$
|
15,767
|
|
$
|
59,151
|
|
$
|
4,913
|
|
|
|
|
$
|
79,831
|
|
|
Collectively evaluated for impairment
|
|
790,228
|
|
|
481,828
|
|
|
261,474
|
|
|
|
|
|
1,533,530
|
|
|
Total loans recorded investment
|
|
805,995
|
|
|
540,979
|
|
|
266,387
|
|
|
|
|
|
1,613,361
|
|
|
Accrued interest included in recorded investment
|
|
1,978
|
|
|
2,364
|
|
|
771
|
|
|
|
|
|
5,113
|
|
|
Total loans
|
$
|
804,017
|
|
$
|
538,615
|
|
$
|
265,616
|
|
|
|
|
$
|
1,608,248
|
|
Non-performing loans include both smaller balance homogeneous loans that are collectively evaluated for impairment and individually classified impaired loans. If these loans had continued to accrue interest in accordance with their original terms, approximately $0.4 million, $0.5 million and $0.6 million of interest income would have been recognized in 2017, 2016 and 2015, respectively. Interest income recorded on these loans was approximately zero during the years ended 2017, 2016 and 2015.
56
NOTES TO CONSOLIDATED FINANCIAL STATEMENTS — (Continued)
Loans on non-accrual status and past due more than 90 days (“Non-performing Loans”) at December 31 follow:
|
|
90+ and
Still Accruing |
Non-
Accrual |
Total Non-
Performing Loans |
||||||
|
|
(In thousands)
|
||||||||
|
2017
|
|
|
|
|
|
|
|
|
|
|
Commercial
|
|
|
|
|
|
|
|
|
|
|
Income producing - real estate
|
$
|
—
|
|
$
|
30
|
|
$
|
30
|
|
|
Land, land development and construction - real estate
|
|
—
|
|
|
9
|
|
|
9
|
|
|
Commercial and industrial
|
|
—
|
|
|
607
|
|
|
607
|
|
|
Mortgage
|
|
|
|
|
|
|
|
|
|
|
1-4 family
|
|
—
|
|
|
5,130
|
|
|
5,130
|
|
|
Resort lending
|
|
—
|
|
|
1,223
|
|
|
1,223
|
|
|
Home equity - 1st lien
|
|
—
|
|
|
326
|
|
|
326
|
|
|
Home equity - 2nd lien
|
|
—
|
|
|
316
|
|
|
316
|
|
|
Purchased loans
|
|
—
|
|
|
—
|
|
|
—
|
|
|
Installment
|
|
|
|
|
|
|
|
|
|
|
Home equity - 1st lien
|
|
—
|
|
|
141
|
|
|
141
|
|
|
Home equity - 2nd lien
|
|
—
|
|
|
159
|
|
|
159
|
|
|
Boat lending
|
|
—
|
|
|
100
|
|
|
100
|
|
|
Recreational vehicle lending
|
|
—
|
|
|
25
|
|
|
25
|
|
|
Other
|
|
—
|
|
|
118
|
|
|
118
|
|
|
Total recorded investment
|
$
|
—
|
|
$
|
8,184
|
|
$
|
8,184
|
|
|
Accrued interest included in recorded investment
|
$
|
—
|
|
$
|
—
|
|
$
|
—
|
|
|
2016
|
|
|
|
|
|
|
|
|
|
|
Commercial
|
|
|
|
|
|
|
|
|
|
|
Income producing - real estate
|
$
|
—
|
|
$
|
628
|
|
$
|
628
|
|
|
Land, land development and construction - real estate
|
|
—
|
|
|
105
|
|
|
105
|
|
|
Commercial and industrial
|
|
—
|
|
|
4,430
|
|
|
4,430
|
|
|
Mortgage
|
|
|
|
|
|
|
|
|
|
|
1-4 family
|
|
—
|
|
|
5,248
|
|
|
5,248
|
|
|
Resort lending
|
|
—
|
|
|
1,507
|
|
|
1,507
|
|
|
Home equity - 1st lien
|
|
—
|
|
|
222
|
|
|
222
|
|
|
Home equity - 2nd lien
|
|
—
|
|
|
317
|
|
|
317
|
|
|
Purchased loans
|
|
—
|
|
|
—
|
|
|
—
|
|
|
Installment
|
|
|
|
|
|
|
|
|
|
|
Home equity - 1st lien
|
|
—
|
|
|
266
|
|
|
266
|
|
|
Home equity - 2nd lien
|
|
—
|
|
|
289
|
|
|
289
|
|
|
Boat lending
|
|
—
|
|
|
219
|
|
|
219
|
|
|
Recreational vehicle lending
|
|
—
|
|
|
21
|
|
|
21
|
|
|
Other
|
|
—
|
|
|
112
|
|
|
112
|
|
|
Total recorded investment
|
$
|
—
|
|
$
|
13,364
|
|
$
|
13,364
|
|
|
Accrued interest included in recorded investment
|
$
|
—
|
|
$
|
—
|
|
$
|
—
|
|
57
NOTES TO CONSOLIDATED FINANCIAL STATEMENTS — (Continued)
An aging analysis of loans by class at December 31 follows:
|
|
Loans Past Due
|
Loans not
Past Due |
Total
Loans |
|||||||||||||||
|
|
30-59 days
|
60-89 days
|
90+ days
|
Total
|
||||||||||||||
|
|
(In thousands)
|
|||||||||||||||||
|
2017
|
|
|
|
|
|
|
|
|
|
|
|
|
|
|
|
|
|
|
|
Commercial
|
|
|
|
|
|
|
|
|
|
|
|
|
|
|
|
|
|
|
|
Income producing - real estate
|
$
|
—
|
|
$
|
—
|
|
$
|
30
|
|
$
|
30
|
|
$
|
290,466
|
|
$
|
290,496
|
|
|
Land, land development and construction - real estate
|
|
9
|
|
|
—
|
|
|
—
|
|
|
9
|
|
|
70,182
|
|
|
70,191
|
|
|
Commercial and industrial
|
|
60
|
|
|
—
|
|
|
44
|
|
|
104
|
|
|
494,769
|
|
|
494,873
|
|
|
Mortgage
|
|
|
|
|
|
|
|
|
|
|
|
|
|
|
|
|
|
|
|
1-4 family
|
|
1,552
|
|
|
802
|
|
|
5,130
|
|
|
7,484
|
|
|
625,638
|
|
|
633,122
|
|
|
Resort lending
|
|
713
|
|
|
—
|
|
|
1,223
|
|
|
1,936
|
|
|
88,620
|
|
|
90,556
|
|
|
Home equity - 1st lien
|
|
308
|
|
|
38
|
|
|
326
|
|
|
672
|
|
|
34,689
|
|
|
35,361
|
|
|
Home equity - 2nd lien
|
|
353
|
|
|
155
|
|
|
316
|
|
|
824
|
|
|
58,834
|
|
|
59,658
|
|
|
Purchased loans
|
|
7
|
|
|
—
|
|
|
—
|
|
|
7
|
|
|
34,104
|
|
|
34,111
|
|
|
Installment
|
|
|
|
|
|
|
|
|
|
|
|
|
|
|
|
|
|
|
|
Home equity - 1st lien
|
|
90
|
|
|
11
|
|
|
141
|
|
|
242
|
|
|
9,213
|
|
|
9,455
|
|
|
Home equity - 2nd lien
|
|
217
|
|
|
94
|
|
|
159
|
|
|
470
|
|
|
9,001
|
|
|
9,471
|
|
|
Boat lending
|
|
59
|
|
|
36
|
|
|
100
|
|
|
195
|
|
|
129,777
|
|
|
129,972
|
|
|
Recreational vehicle lending
|
|
28
|
|
|
20
|
|
|
25
|
|
|
73
|
|
|
92,737
|
|
|
92,810
|
|
|
Other
|
|
275
|
|
|
115
|
|
|
118
|
|
|
508
|
|
|
74,734
|
|
|
75,242
|
|
|
Total recorded investment
|
$
|
3,671
|
|
$
|
1,271
|
|
$
|
7,612
|
|
$
|
12,554
|
|
$
|
2,012,764
|
|
$
|
2,025,318
|
|
|
Accrued interest included in recorded investment
|
$
|
43
|
|
$
|
22
|
|
$
|
—
|
|
$
|
65
|
|
$
|
6,436
|
|
$
|
6,501
|
|
|
|
|
|
|
|
|
|
|
|
|
|
|
|
|
|
|
|
|
|
|
2016
|
|
|
|
|
|
|
|
|
|
|
|
|
|
|
|
|
|
|
|
Commercial
|
|
|
|
|
|
|
|
|
|
|
|
|
|
|
|
|
|
|
|
Income producing - real estate
|
$
|
—
|
|
$
|
—
|
|
$
|
383
|
|
$
|
383
|
|
$
|
287,255
|
|
$
|
287,638
|
|
|
Land, land development and construction - real estate
|
|
74
|
|
|
—
|
|
|
31
|
|
|
105
|
|
|
51,670
|
|
|
51,775
|
|
|
Commercial and industrial
|
|
100
|
|
|
1,385
|
|
|
66
|
|
|
1,551
|
|
|
465,031
|
|
|
466,582
|
|
|
Mortgage
|
|
|
|
|
|
|
|
|
|
|
|
|
|
|
|
|
|
|
|
1-4 family
|
|
2,361
|
|
|
869
|
|
|
5,248
|
|
|
8,478
|
|
|
306,063
|
|
|
314,541
|
|
|
Resort lending
|
|
—
|
|
|
—
|
|
|
1,507
|
|
|
1,507
|
|
|
101,541
|
|
|
103,048
|
|
|
Home equity - 1st lien
|
|
149
|
|
|
—
|
|
|
222
|
|
|
371
|
|
|
28,645
|
|
|
29,016
|
|
|
Home equity - 2nd lien
|
|
470
|
|
|
218
|
|
|
317
|
|
|
1,005
|
|
|
54,232
|
|
|
55,237
|
|
|
Purchased loans
|
|
13
|
|
|
2
|
|
|
—
|
|
|
15
|
|
|
39,122
|
|
|
39,137
|
|
|
Installment
|
|
|
|
|
|
|
|
|
|
|
|
|
|
|
|
|
|
|
|
Home equity - 1st lien
|
|
311
|
|
|
48
|
|
|
266
|
|
|
625
|
|
|
12,025
|
|
|
12,650
|
|
|
Home equity - 2nd lien
|
|
238
|
|
|
41
|
|
|
289
|
|
|
568
|
|
|
13,390
|
|
|
13,958
|
|
|
Boat lending
|
|
184
|
|
|
33
|
|
|
219
|
|
|
436
|
|
|
102,489
|
|
|
102,925
|
|
|
Recreational vehicle lending
|
|
68
|
|
|
33
|
|
|
21
|
|
|
122
|
|
|
74,413
|
|
|
74,535
|
|
|
Other
|
|
289
|
|
|
30
|
|
|
112
|
|
|
431
|
|
|
61,888
|
|
|
62,319
|
|
|
Total recorded investment
|
$
|
4,257
|
|
$
|
2,659
|
|
$
|
8,681
|
|
$
|
15,597
|
|
$
|
1,597,764
|
|
$
|
1,613,361
|
|
|
Accrued interest included in recorded investment
|
$
|
45
|
|
$
|
19
|
|
$
|
—
|
|
$
|
64
|
|
$
|
5,049
|
|
$
|
5,113
|
|
58
NOTES TO CONSOLIDATED FINANCIAL STATEMENTS — (Continued)
Impaired loans are as follows :
|
|
December 31,
|
|||||
|
|
2017
|
2016
|
||||
|
|
(In thousands)
|
|||||
|
Impaired loans with no allocated allowance
|
|
|
|
|
|
|
|
TDR
|
$
|
349
|
|
$
|
1,782
|
|
|
Non - TDR
|
|
175
|
|
|
1,107
|
|
|
Impaired loans with an allocated allowance
|
|
|
|
|
|
|
|
TDR - allowance based on collateral
|
|
2,482
|
|
|
3,527
|
|
|
TDR - allowance based on present value cash flow
|
|
62,113
|
|
|
72,613
|
|
|
Non - TDR - allowance based on collateral
|
|
148
|
|
|
491
|
|
|
Total impaired loans
|
$
|
65,267
|
|
$
|
79,520
|
|
|
|
|
|
|
|
|
|
|
Amount of allowance for loan losses allocated
|
|
|
|
|
|
|
|
TDR - allowance based on collateral
|
$
|
684
|
|
$
|
1,868
|
|
|
TDR - allowance based on present value cash flow
|
|
6,089
|
|
|
7,146
|
|
|
Non - TDR - allowance based on collateral
|
|
66
|
|
|
138
|
|
|
Total amount of allowance for loan losses allocated
|
$
|
6,839
|
|
$
|
9,152
|
|
Impaired loans by class as of December 31 are as follows (1):
|
|
2017
|
2016
|
||||||||||||||||
|
|
Recorded
Investment |
Unpaid
Principal Balance |
Related
Allowance |
Recorded
Investment |
Unpaid
Principal Balance |
Related
Allowance |
||||||||||||
|
|
(In thousands)
|
|||||||||||||||||
|
With no related allowance recorded:
|
|
|
|
|
|
|
|
|
|
|
|
|
|
|
|
|||
|
Commercial
|
|
|
|
|
|
|
|
|
|
|
|
|
|
|
|
|
|
|
|
Income producing - real estate
|
$
|
—
|
|
$
|
—
|
|
$
|
—
|
|
$
|
517
|
|
$
|
768
|
|
$
|
—
|
|
|
Land, land development & construction-real estate
|
|
—
|
|
|
—
|
|
|
—
|
|
|
31
|
|
|
709
|
|
|
—
|
|
|
Commercial and industrial
|
|
524
|
|
|
549
|
|
|
—
|
|
|
2,341
|
|
|
3,261
|
|
|
—
|
|
|
Mortgage
|
|
|
|
|
|
|
|
|
|
|
|
|
|
|
|
|
|
|
|
1-4 family
|
|
2
|
|
|
469
|
|
|
—
|
|
|
2
|
|
|
387
|
|
|
—
|
|
|
Resort lending
|
|
—
|
|
|
—
|
|
|
—
|
|
|
—
|
|
|
—
|
|
|
—
|
|
|
Home equity - 1st lien
|
|
—
|
|
|
—
|
|
|
—
|
|
|
—
|
|
|
—
|
|
|
—
|
|
|
Home equity - 2nd lien
|
|
—
|
|
|
—
|
|
|
—
|
|
|
—
|
|
|
—
|
|
|
—
|
|
|
Installment
|
|
|
|
|
|
|
|
|
|
|
|
|
|
|
|
|
|
|
|
Home equity - 1st lien
|
|
1
|
|
|
69
|
|
|
—
|
|
|
—
|
|
|
66
|
|
|
—
|
|
|
Home equity - 2nd lien
|
|
—
|
|
|
—
|
|
|
—
|
|
|
—
|
|
|
—
|
|
|
—
|
|
|
Boat lending
|
|
—
|
|
|
—
|
|
|
—
|
|
|
—
|
|
|
—
|
|
|
—
|
|
|
Recreational vehicle lending
|
|
—
|
|
|
—
|
|
|
—
|
|
|
—
|
|
|
—
|
|
|
—
|
|
|
Other
|
|
—
|
|
|
—
|
|
|
—
|
|
|
—
|
|
|
—
|
|
|
—
|
|
|
|
|
527
|
|
|
1,087
|
|
|
—
|
|
|
2,891
|
|
|
5,191
|
|
|
—
|
|
59
NOTES TO CONSOLIDATED FINANCIAL STATEMENTS — (Continued)
|
|
2017
|
2016
|
||||||||||||||||
|
|
Recorded
Investment |
Unpaid
Principal Balance |
Related
Allowance |
Recorded
Investment |
Unpaid
Principal Balance |
Related
Allowance |
||||||||||||
|
|
(In thousands)
|
|||||||||||||||||
|
With an allowance recorded:
|
|
|
|
|
|
|
|
|
|
|
|
|
|
|
|
|
|
|
|
Commercial
|
|
|
|
|
|
|
|
|
|
|
|
|
|
|
|
|
|
|
|
Income producing - real estate
|
|
5,195
|
|
|
5,347
|
|
|
347
|
|
|
7,737
|
|
|
7,880
|
|
|
554
|
|
|
Land, land development & construction-real estate
|
|
166
|
|
|
194
|
|
|
9
|
|
|
239
|
|
|
244
|
|
|
36
|
|
|
Commercial and industrial
|
|
2,535
|
|
|
2,651
|
|
|
481
|
|
|
4,902
|
|
|
5,246
|
|
|
1,654
|
|
|
Mortgage
|
|
|
|
|
|
|
|
|
|
|
|
|
|
|
|
|
|
|
|
1-4 family
|
|
36,848
|
|
|
38,480
|
|
|
3,454
|
|
|
41,701
|
|
|
43,479
|
|
|
4,100
|
|
|
Resort lending
|
|
15,978
|
|
|
16,046
|
|
|
2,210
|
|
|
16,898
|
|
|
16,931
|
|
|
2,453
|
|
|
Home equity - 1st lien
|
|
173
|
|
|
236
|
|
|
43
|
|
|
235
|
|
|
242
|
|
|
10
|
|
|
Home equity - 2nd lien
|
|
178
|
|
|
213
|
|
|
18
|
|
|
315
|
|
|
398
|
|
|
16
|
|
|
Installment
|
|
|
|
|
|
|
|
|
|
|
|
|
|
|
|
|
|
|
|
Home equity - 1st lien
|
|
1,667
|
|
|
1,804
|
|
|
108
|
|
|
1,994
|
|
|
2,117
|
|
|
118
|
|
|
Home equity - 2nd lien
|
|
1,793
|
|
|
1,805
|
|
|
140
|
|
|
2,415
|
|
|
2,443
|
|
|
182
|
|
|
Boat lending
|
|
1
|
|
|
5
|
|
|
1
|
|
|
1
|
|
|
6
|
|
|
1
|
|
|
Recreational vehicle lending
|
|
90
|
|
|
90
|
|
|
5
|
|
|
109
|
|
|
108
|
|
|
6
|
|
|
Other
|
|
393
|
|
|
418
|
|
|
23
|
|
|
394
|
|
|
426
|
|
|
22
|
|
|
|
|
65,017
|
|
|
67,289
|
|
|
6,839
|
|
|
76,940
|
|
|
79,520
|
|
|
9,152
|
|
|
Total
|
|
|
|
|
|
|
|
|
|
|
|
|
|
|
|
|
|
|
|
Commercial
|
|
|
|
|
|
|
|
|
|
|
|
|
|
|
|
|
|
|
|
Income producing - real estate
|
|
5,195
|
|
|
5,347
|
|
|
347
|
|
|
8,254
|
|
|
8,648
|
|
|
554
|
|
|
Land, land development & construction-real estate
|
|
166
|
|
|
194
|
|
|
9
|
|
|
270
|
|
|
953
|
|
|
36
|
|
|
Commercial and industrial
|
|
3,059
|
|
|
3,200
|
|
|
481
|
|
|
7,243
|
|
|
8,507
|
|
|
1,654
|
|
|
Mortgage
|
|
|
|
|
|
|
|
|
|
|
|
|
|
|
|
|
|
|
|
1-4 family
|
|
36,850
|
|
|
38,949
|
|
|
3,454
|
|
|
41,703
|
|
|
43,866
|
|
|
4,100
|
|
|
Resort lending
|
|
15,978
|
|
|
16,046
|
|
|
2,210
|
|
|
16,898
|
|
|
16,931
|
|
|
2,453
|
|
|
Home equity - 1st lien
|
|
173
|
|
|
236
|
|
|
43
|
|
|
235
|
|
|
242
|
|
|
10
|
|
|
Home equity - 2nd lien
|
|
178
|
|
|
213
|
|
|
18
|
|
|
315
|
|
|
398
|
|
|
16
|
|
|
Installment
|
|
|
|
|
|
|
|
|
|
|
|
|
|
|
|
|
|
|
|
Home equity - 1st lien
|
|
1,668
|
|
|
1,873
|
|
|
108
|
|
|
1,994
|
|
|
2,183
|
|
|
118
|
|
|
Home equity - 2nd lien
|
|
1,793
|
|
|
1,805
|
|
|
140
|
|
|
2,415
|
|
|
2,443
|
|
|
182
|
|
|
Boat lending
|
|
1
|
|
|
5
|
|
|
1
|
|
|
1
|
|
|
6
|
|
|
1
|
|
|
Recreational vehicle lending
|
|
90
|
|
|
90
|
|
|
5
|
|
|
109
|
|
|
108
|
|
|
6
|
|
|
Other
|
|
393
|
|
|
418
|
|
|
23
|
|
|
394
|
|
|
426
|
|
|
22
|
|
|
Total
|
$
|
65,544
|
|
$
|
68,376
|
|
$
|
6,839
|
|
$
|
79,831
|
|
$
|
84,711
|
|
$
|
9,152
|
|
|
Accrued interest included in recorded investment
|
$
|
277
|
|
|
|
|
|
|
|
$
|
311
|
|
|
|
|
|
|
|
| (1) | There were no impaired purchased mortgage loans at December 31, 2017 or 2016. |
60
NOTES TO CONSOLIDATED FINANCIAL STATEMENTS — (Continued)
Average recorded investment in and interest income earned (of which the majority of these amounts were received in cash and related primarily to performing TDR’s) on impaired loans by class for the years ended December 31 follows (1):
|
|
2017
|
2016
|
2015
|
|||||||||||||||
|
|
Average
Recorded Investment |
Interest
Income Recognized |
Average
Recorded Investment |
Interest
Income Recognized |
Average
Recorded Investment |
Interest
Income Recognized |
||||||||||||
|
|
(In thousands)
|
|||||||||||||||||
|
With no related allowance recorded:
|
|
|
|
|
|
|
|
|
|
|
|
|
|
|
|
|
|
|
|
Commercial
|
|
|
|
|
|
|
|
|
|
|
|
|
|
|
|
|
|
|
|
Income producing - real estate
|
$
|
177
|
|
$
|
—
|
|
$
|
609
|
|
$
|
2
|
|
$
|
4,520
|
|
$
|
387
|
|
|
Land, land development & construction-real estate
|
|
6
|
|
|
—
|
|
|
330
|
|
|
7
|
|
|
952
|
|
|
79
|
|
|
Commercial and industrial
|
|
751
|
|
|
22
|
|
|
961
|
|
|
54
|
|
|
2,125
|
|
|
257
|
|
|
Mortgage
|
|
|
|
|
|
|
|
|
|
|
|
|
|
|
|
|
|
|
|
1-4 family
|
|
52
|
|
|
21
|
|
|
10
|
|
|
16
|
|
|
19
|
|
|
11
|
|
|
Resort lending
|
|
—
|
|
|
—
|
|
|
—
|
|
|
—
|
|
|
12
|
|
|
—
|
|
|
Home equity - 1st lien
|
|
—
|
|
|
—
|
|
|
—
|
|
|
—
|
|
|
—
|
|
|
—
|
|
|
Home equity - 2nd lien
|
|
—
|
|
|
—
|
|
|
—
|
|
|
—
|
|
|
—
|
|
|
—
|
|
|
Installment
|
|
|
|
|
|
|
|
|
|
|
|
|
|
|
|
|
|
|
|
Home equity - 1st lien
|
|
1
|
|
|
6
|
|
|
—
|
|
|
5
|
|
|
—
|
|
|
5
|
|
|
Home equity - 2nd lien
|
|
—
|
|
|
—
|
|
|
3
|
|
|
—
|
|
|
—
|
|
|
—
|
|
|
Boat lending
|
|
—
|
|
|
—
|
|
|
—
|
|
|
—
|
|
|
—
|
|
|
—
|
|
|
Recreational vehicle lending
|
|
—
|
|
|
—
|
|
|
—
|
|
|
—
|
|
|
—
|
|
|
—
|
|
|
Other
|
|
—
|
|
|
—
|
|
|
—
|
|
|
—
|
|
|
—
|
|
|
—
|
|
|
|
|
987
|
|
|
49
|
|
|
1,913
|
|
|
84
|
|
|
7,628
|
|
|
739
|
|
|
With an allowance recorded:
|
|
|
|
|
|
|
|
|
|
|
|
|
|
|
|
|
|
|
|
Commercial
|
|
|
|
|
|
|
|
|
|
|
|
|
|
|
|
|
|
|
|
Income producing - real estate
|
|
7,059
|
|
|
369
|
|
|
8,069
|
|
|
427
|
|
|
12,677
|
|
|
439
|
|
|
Land, land development & construction-real estate
|
|
183
|
|
|
8
|
|
|
1,129
|
|
|
31
|
|
|
2,219
|
|
|
54
|
|
|
Commercial and industrial
|
|
3,298
|
|
|
132
|
|
|
5,723
|
|
|
189
|
|
|
6,663
|
|
|
104
|
|
|
Mortgage
|
|
|
|
|
|
|
|
|
|
|
|
|
|
|
|
|
|
|
|
1-4 family
|
|
39,143
|
|
|
1,774
|
|
|
44,923
|
|
|
1,918
|
|
|
50,421
|
|
|
2,140
|
|
|
Resort lending
|
|
16,383
|
|
|
616
|
|
|
17,544
|
|
|
619
|
|
|
18,448
|
|
|
670
|
|
|
Home equity - 1st lien
|
|
209
|
|
|
5
|
|
|
226
|
|
|
10
|
|
|
161
|
|
|
8
|
|
|
Home equity - 2nd lien
|
|
209
|
|
|
7
|
|
|
248
|
|
|
14
|
|
|
172
|
|
|
13
|
|
|
Installment
|
|
|
|
|
|
|
|
|
|
|
|
|
|
|
|
|
|
|
|
Home equity - 1st lien
|
|
1,832
|
|
|
128
|
|
|
2,185
|
|
|
147
|
|
|
2,539
|
|
|
176
|
|
|
Home equity - 2nd lien
|
|
2,126
|
|
|
112
|
|
|
2,661
|
|
|
162
|
|
|
3,055
|
|
|
193
|
|
|
Boat lending
|
|
1
|
|
|
1
|
|
|
2
|
|
|
1
|
|
|
3
|
|
|
1
|
|
|
Recreational vehicle lending
|
|
100
|
|
|
5
|
|
|
115
|
|
|
6
|
|
|
127
|
|
|
7
|
|
|
Other
|
|
377
|
|
|
25
|
|
|
433
|
|
|
28
|
|
|
533
|
|
|
30
|
|
|
|
|
70,920
|
|
|
3,182
|
|
|
83,258
|
|
|
3,552
|
|
|
97,018
|
|
|
3,835
|
|
61
NOTES TO CONSOLIDATED FINANCIAL STATEMENTS — (Continued)
|
|
2017
|
2016
|
2015
|
|||||||||||||||
|
|
Average
Recorded Investment |
Interest
Income Recognized |
Average
Recorded Investment |
Interest
Income Recognized |
Average
Recorded Investment |
Interest
Income Recognized |
||||||||||||
|
|
(In thousands)
|
|||||||||||||||||
|
Total
|
|
|
|
|
|
|
|
|
|
|
|
|
|
|
|
|
|
|
|
Commercial
|
|
|
|
|
|
|
|
|
|
|
|
|
|
|
|
|
|
|
|
Income producing - real estate
|
|
7,236
|
|
|
369
|
|
|
8,678
|
|
|
429
|
|
|
17,197
|
|
|
826
|
|
|
Land, land development & construction-real estate
|
|
189
|
|
|
8
|
|
|
1,459
|
|
|
38
|
|
|
3,171
|
|
|
133
|
|
|
Commercial and industrial
|
|
4,049
|
|
|
154
|
|
|
6,684
|
|
|
243
|
|
|
8,788
|
|
|
361
|
|
|
Mortgage
|
|
|
|
|
|
|
|
|
|
|
|
|
|
|
|
|
|
|
|
1-4 family
|
|
39,195
|
|
|
1,795
|
|
|
44,933
|
|
|
1,934
|
|
|
50,440
|
|
|
2,151
|
|
|
Resort lending
|
|
16,383
|
|
|
616
|
|
|
17,544
|
|
|
619
|
|
|
18,460
|
|
|
670
|
|
|
Home equity - 1st lien
|
|
209
|
|
|
5
|
|
|
226
|
|
|
10
|
|
|
161
|
|
|
8
|
|
|
Home equity - 2nd lien
|
|
209
|
|
|
7
|
|
|
248
|
|
|
14
|
|
|
172
|
|
|
13
|
|
|
Installment
|
|
|
|
|
|
|
|
|
|
|
|
|
|
|
|
|
|
|
|
Home equity - 1st lien
|
|
1,833
|
|
|
134
|
|
|
2,185
|
|
|
152
|
|
|
2,539
|
|
|
181
|
|
|
Home equity - 2nd lien
|
|
2,126
|
|
|
112
|
|
|
2,664
|
|
|
162
|
|
|
3,055
|
|
|
193
|
|
|
Boat lending
|
|
1
|
|
|
1
|
|
|
2
|
|
|
1
|
|
|
3
|
|
|
1
|
|
|
Recreational vehicle lending
|
|
100
|
|
|
5
|
|
|
115
|
|
|
6
|
|
|
127
|
|
|
7
|
|
|
Other
|
|
377
|
|
|
25
|
|
|
433
|
|
|
28
|
|
|
533
|
|
|
30
|
|
|
Total
|
$
|
71,907
|
|
$
|
3,231
|
|
$
|
85,171
|
|
$
|
3,636
|
|
$
|
104,646
|
|
$
|
4,574
|
|
| (1) | There were no impaired payment plan receivables or purchased mortgage loans during the years ending December 31, 2017, 2016 and 2015. |
Troubled debt restructurings at December 31 follow:
|
|
2017
|
||||||||
|
|
Commercial
|
Retail (1)
|
Total
|
||||||
|
|
(In thousands)
|
||||||||
|
Performing TDR's
|
$
|
7,748
|
|
$
|
52,367
|
|
$
|
60,115
|
|
|
Non-performing TDR's (2)
|
|
323
|
|
|
4,506
|
(3)
|
|
4,829
|
|
|
Total
|
$
|
8,071
|
|
$
|
56,873
|
|
$
|
64,944
|
|
|
|
2016
|
||||||||
|
|
Commercial
|
Retail (1)
|
Total
|
||||||
|
|
(In thousands)
|
||||||||
|
Performing TDR's
|
$
|
10,560
|
|
$
|
59,726
|
|
$
|
70,286
|
|
|
Non-performing TDR's (2)
|
|
3,565
|
|
|
4,071
|
(3)
|
|
7,636
|
|
|
Total
|
$
|
14,125
|
|
$
|
63,797
|
|
$
|
77,922
|
|
| (1) | Retail loans include mortgage and installment loan segments. |
| (2) | Included in non-performing loans table above. |
| (3) | Also includes loans on non-accrual at the time of modification until six payments are received on a timely basis. |
62
NOTES TO CONSOLIDATED FINANCIAL STATEMENTS — (Continued)
We have allocated $6.8 million and $9.0 million of specific reserves to customers whose loan terms have been modified in troubled debt restructurings as of December 31, 2017 and 2016, respectively. We have committed to lend additional amounts totaling up to $0.04 million at both December 31, 2017 and 2016, respectively, to customers with outstanding loans that are classified as troubled debt restructurings.
The terms of certain loans were modified as troubled debt restructurings and generally included one or a combination of the following: a reduction of the stated interest rate of the loan; an extension of the maturity date at a stated rate of interest lower than the current market rate for new debt with similar risk; or a permanent reduction of the recorded investment in the loan.
Modifications involving a reduction of the stated interest rate of the loan have generally been for periods ranging from 9 months to 36 months but have extended to as much as 480 months in certain circumstances. Modifications involving an extension of the maturity date have generally been for periods ranging from 1 month to 60 months but have extended to as much as 230 months in certain circumstances.
Loans that have been classified as troubled debt restructurings during the years ended December 31 follow (1):
|
|
Number of
Contracts |
Pre-modification
Recorded Balance |
Post-modification
Recorded Balance |
||||||
|
|
(Dollars in thousands)
|
||||||||
|
2017
|
|
|
|
|
|
|
|
|
|
|
Commercial
|
|
|
|
|
|
|
|
|
|
|
Income producing - real estate
|
|
—
|
|
$
|
—
|
|
$
|
—
|
|
|
Land, land development & construction-real estate
|
|
—
|
|
|
—
|
|
|
—
|
|
|
Commercial and industrial
|
|
15
|
|
|
925
|
|
|
925
|
|
|
Mortgage
|
|
|
|
|
|
|
|
|
|
|
1-4 family
|
|
6
|
|
|
456
|
|
|
462
|
|
|
Resort lending
|
|
1
|
|
|
189
|
|
|
189
|
|
|
Home equity - 1st lien
|
|
—
|
|
|
—
|
|
|
—
|
|
|
Home equity - 2nd lien
|
|
—
|
|
|
—
|
|
|
—
|
|
|
Installment
|
|
|
|
|
|
|
|
|
|
|
Home equity - 1st lien
|
|
3
|
|
|
86
|
|
|
90
|
|
|
Home equity - 2nd lien
|
|
10
|
|
|
391
|
|
|
394
|
|
|
Boat lending
|
|
—
|
|
|
—
|
|
|
—
|
|
|
Recreational vehicle lending
|
|
—
|
|
|
—
|
|
|
—
|
|
|
Other
|
|
2
|
|
|
74
|
|
|
75
|
|
|
Total
|
|
37
|
|
$
|
2,121
|
|
$
|
2,135
|
|
|
2016
|
|
|
|
|
|
|
|
|
|
|
Commercial
|
|
|
|
|
|
|
|
|
|
|
Income producing - real estate
|
|
4
|
|
$
|
290
|
|
$
|
290
|
|
|
Land, land development & construction-real estate
|
|
—
|
|
|
—
|
|
|
—
|
|
|
Commercial and industrial
|
|
9
|
|
|
2,044
|
|
|
2,027
|
|
|
Mortgage
|
|
|
|
|
|
|
|
|
|
|
1-4 family
|
|
9
|
|
|
927
|
|
|
1,004
|
|
|
Resort lending
|
|
1
|
|
|
116
|
|
|
117
|
|
|
Home equity - 1st lien
|
|
1
|
|
|
107
|
|
|
78
|
|
|
Home equity - 2nd lien
|
|
2
|
|
|
77
|
|
|
78
|
|
|
Installment
|
|
|
|
|
|
|
|
|
|
|
Home equity - 1st lien
|
|
6
|
|
|
141
|
|
|
145
|
|
|
Home equity - 2nd lien
|
|
6
|
|
|
154
|
|
|
157
|
|
|
Boat lending
|
|
—
|
|
|
—
|
|
|
—
|
|
|
Recreational vehicle lending
|
|
—
|
|
|
—
|
|
|
—
|
|
|
Other
|
|
2
|
|
|
46
|
|
|
46
|
|
|
Total
|
|
40
|
|
$
|
3,902
|
|
$
|
3,942
|
|
63
NOTES TO CONSOLIDATED FINANCIAL STATEMENTS — (Continued)
|
|
Number of
Contracts |
Pre-modification
Recorded Balance |
Post-modification
Recorded Balance |
||||||
|
|
(Dollars in thousands)
|
||||||||
|
2015
|
|
|
|
|
|
|
|
|
|
|
Commercial
|
|
|
|
|
|
|
|
|
|
|
Income producing - real estate
|
|
2
|
|
$
|
229
|
|
$
|
227
|
|
|
Land, land development & construction-real estate
|
|
—
|
|
|
—
|
|
|
—
|
|
|
Commercial and industrial
|
|
17
|
|
|
3,188
|
|
|
2,960
|
|
|
Mortgage
|
|
|
|
|
|
|
|
|
|
|
1-4 family
|
|
8
|
|
|
1,345
|
|
|
1,128
|
|
|
Resort lending
|
|
1
|
|
|
313
|
|
|
307
|
|
|
Home equity - 1st lien
|
|
1
|
|
|
20
|
|
|
20
|
|
|
Home equity - 2nd lien
|
|
1
|
|
|
27
|
|
|
27
|
|
|
Installment
|
|
|
|
|
|
|
|
|
|
|
Home equity - 1st lien
|
|
6
|
|
|
220
|
|
|
186
|
|
|
Home equity - 2nd lien
|
|
8
|
|
|
228
|
|
|
217
|
|
|
Boat lending
|
|
—
|
|
|
—
|
|
|
—
|
|
|
Recreational vehicle lending
|
|
—
|
|
|
—
|
|
|
—
|
|
|
Other
|
|
2
|
|
|
19
|
|
|
25
|
|
|
Total
|
|
46
|
|
$
|
5,589
|
|
$
|
5,097
|
|
| (1) | There were no payment plan receivables or purchased mortgage loans classified as troubled debt restructurings during the years ending December 31, 2017, 2016 and 2015. |
The troubled debt restructurings described above increased (decreased) the AFLL by $0.1 million, $(0.1) million and $0.4 million during the years ended December 31, 2017, 2016 and 2015, respectively and resulted in charge offs of zero, $0.53 million and $0.16 million during the years ended December 31, 2017, 2016 and 2015, respectively.
Loans that have been classified as troubled debt restructured during the past twelve months and that have subsequently defaulted during the years ended December 31 follows:
|
|
Number of
Contracts |
Recorded
Balance |
||||
|
|
(Dollars in thousands)
|
|||||
|
2017
|
|
|
|
|
|
|
|
Commercial
|
|
|
|
|
|
|
|
Income producing - real estate
|
|
—
|
|
$
|
—
|
|
|
Land, land development & construction-real estate
|
|
—
|
|
|
—
|
|
|
Commercial and industrial
|
|
6
|
|
|
164
|
|
|
Mortgage
|
|
|
|
|
|
|
|
1-4 family
|
|
—
|
|
|
—
|
|
|
Resort lending
|
|
—
|
|
|
—
|
|
|
Home equity - 1st lien
|
|
—
|
|
|
—
|
|
|
Home equity - 2nd lien
|
|
—
|
|
|
—
|
|
|
Installment
|
|
|
|
|
|
|
|
Home equity - 1st lien
|
|
1
|
|
|
13
|
|
|
Home equity - 2nd lien
|
|
—
|
|
|
—
|
|
|
Boat lending
|
|
—
|
|
|
—
|
|
|
Recreational vehicle lending
|
|
—
|
|
|
—
|
|
|
Other
|
|
—
|
|
|
—
|
|
|
Total
|
|
7
|
|
$
|
177
|
|
64
NOTES TO CONSOLIDATED FINANCIAL STATEMENTS — (Continued)
|
|
Number of
Contracts |
Recorded
Balance |
||||
|
|
(Dollars in thousands)
|
|||||
|
|
|
|
|
|
|
|
|
2016
|
|
|
|
|
|
|
|
Commercial
|
|
|
|
|
|
|
|
Income producing - real estate
|
|
—
|
|
$
|
—
|
|
|
Land, land development & construction-real estate
|
|
—
|
|
|
—
|
|
|
Commercial and industrial
|
|
1
|
|
|
1,767
|
|
|
Mortgage
|
|
|
|
|
|
|
|
1-4 family
|
|
—
|
|
|
—
|
|
|
Resort lending
|
|
—
|
|
|
—
|
|
|
Home equity - 1st lien
|
|
—
|
|
|
—
|
|
|
Home equity - 2nd lien
|
|
—
|
|
|
—
|
|
|
Installment
|
|
|
|
|
|
|
|
Home equity - 1st lien
|
|
—
|
|
|
—
|
|
|
Home equity - 2nd lien
|
|
—
|
|
|
—
|
|
|
Boat lending
|
|
—
|
|
|
—
|
|
|
Recreational vehicle lending
|
|
—
|
|
|
—
|
|
|
Other
|
|
—
|
|
|
—
|
|
|
Total
|
|
1
|
|
$
|
1,767
|
|
|
|
|
|
|
|
|
|
|
2015
|
|
|
|
|
|
|
|
Commercial
|
|
|
|
|
|
|
|
Income producing - real estate
|
|
—
|
|
$
|
—
|
|
|
Land, land development & construction-real estate
|
|
—
|
|
|
—
|
|
|
Commercial and industrial
|
|
2
|
|
|
157
|
|
|
Mortgage
|
|
|
|
|
|
|
|
1-4 family
|
|
2
|
|
|
73
|
|
|
Resort lending
|
|
—
|
|
|
—
|
|
|
Home equity - 1st lien
|
|
—
|
|
|
—
|
|
|
Home equity - 2nd lien
|
|
—
|
|
|
—
|
|
|
Installment
|
|
|
|
|
|
|
|
Home equity - 1st lien
|
|
—
|
|
|
—
|
|
|
Home equity - 2nd lien
|
|
—
|
|
|
—
|
|
|
Boat lending
|
|
—
|
|
|
—
|
|
|
Recreational vehicle lending
|
|
—
|
|
|
—
|
|
|
Other
|
|
1
|
|
|
4
|
|
|
Total
|
|
5
|
|
$
|
234
|
|
A loan is generally considered to be in payment default once it is 90 days contractually past due under the modified terms for commercial loans and installment loans and when four consecutive payments are missed for mortgage loans.
The troubled debt restructurings that subsequently defaulted described above increased (decreased) the AFLL by $0.04 million, $(0.17) million and $(0.03) million during the years ended December 31, 2017, 2016 and 2015, respectively and resulted in charge offs of $0.05 million, $0.51 million, and zero during the years ended December 31, 2017, 2016 and 2015, respectively.
65
NOTES TO CONSOLIDATED FINANCIAL STATEMENTS — (Continued)
The terms of certain other loans were modified during the years ending December 31, 2017, 2016 and 2015 that did not meet the definition of a troubled debt restructuring. The modification of these loans could have included modification of the terms of a loan to borrowers who were not experiencing financial difficulties or a delay in a payment that was considered to be insignificant.
In order to determine whether a borrower is experiencing financial difficulty, we perform an evaluation of the probability that the borrower will be in payment default on any of its debt in the foreseeable future without the modification. This evaluation is performed under our internal underwriting policy.
Credit Quality Indicators – As part of our on on-going monitoring of the credit quality of our loan portfolios, we track certain credit quality indicators including (a) weighted-average risk grade of commercial loans, (b) the level of classified commercial loans, (c) credit scores of mortgage and installment loan borrowers, and (d) delinquency history and non-performing loans.
For commercial loans, we use a loan rating system that is similar to those employed by state and federal banking regulators. Loans are graded on a scale of 1 to 12. A description of the general characteristics of the ratings follows:
Rating 1 through 6: These loans are generally referred to as our “non-watch” commercial credits that include very high or exceptional credit fundamentals through acceptable credit fundamentals.
Rating 7 and 8: These loans are generally referred to as our “watch” commercial credits. These ratings include loans to borrowers that exhibit potential credit weakness or downward trends. If not checked or cured these trends could weaken our asset or credit position. While potentially weak, no loss of principal or interest is envisioned with these ratings.
Rating 9: These loans are generally referred to as our “substandard accruing” commercial credits. This rating includes loans to borrowers that exhibit a well-defined weakness where payment default is probable and loss is possible if deficiencies are not corrected. Generally, loans with this rating are considered collectible as to both principal and interest primarily due to collateral coverage.
Rating 10 and 11: These loans are generally referred to as our “substandard - non-accrual” and “doubtful” commercial credits. Our doubtful rating includes a sub classification for a loss rate other than 50% (which is the standard doubtful loss rate). These ratings include loans to borrowers with weaknesses that make collection of debt in full, on the basis of current facts, conditions and values at best questionable and at worst improbable. All of these loans are placed in non-accrual.
Rating 12: These loans are generally referred to as our “loss” commercial credits. This rating includes loans to borrowers that are deemed incapable of repayment and are charged-off.
The following table summarizes loan ratings by loan class for our commercial loan segment at December 31:
|
|
Commercial
|
||||||||||||||
|
|
Non-watch
1-6 |
Watch
7-8 |
Substandard
Accrual 9 |
Non-
Accrual 10-11 |
Total
|
||||||||||
|
|
(In thousands)
|
||||||||||||||
|
2017
|
|
|
|
|
|
|
|
|
|
|
|
|
|
|
|
|
Income producing - real estate
|
$
|
288,869
|
|
$
|
1,293
|
|
$
|
304
|
|
$
|
30
|
|
$
|
290,496
|
|
|
Land, land development and construction - real estate
|
|
70,122
|
|
|
60
|
|
|
—
|
|
|
9
|
|
|
70,191
|
|
|
Commercial and industrial
|
|
463,570
|
|
|
28,351
|
|
|
2,345
|
|
|
607
|
|
|
494,873
|
|
|
Total
|
$
|
822,561
|
|
$
|
29,704
|
|
$
|
2,649
|
|
$
|
646
|
|
$
|
855,560
|
|
|
Accrued interest included in total
|
$
|
2,198
|
|
$
|
94
|
|
$
|
8
|
|
$
|
—
|
|
$
|
2,300
|
|
66
NOTES TO CONSOLIDATED FINANCIAL STATEMENTS — (Continued)
|
|
Commercial
|
||||||||||||||
|
|
Non-watch
1-6 |
Watch
7-8 |
Substandard
Accrual 9 |
Non-
Accrual 10-11 |
Total
|
||||||||||
|
|
(In thousands)
|
||||||||||||||
|
2016
|
|
|
|
|
|
|
|
|
|
|
|
|
|
|
|
|
Income producing - real estate
|
$
|
282,886
|
|
$
|
3,787
|
|
$
|
337
|
|
$
|
628
|
|
$
|
287,638
|
|
|
Land, land development and construction - real estate
|
|
51,603
|
|
|
67
|
|
|
—
|
|
|
105
|
|
|
51,775
|
|
|
Commercial and industrial
|
|
449,365
|
|
|
9,788
|
|
|
2,998
|
|
|
4,431
|
|
|
466,582
|
|
|
Total
|
$
|
783,854
|
|
$
|
13,642
|
|
$
|
3,335
|
|
$
|
5,164
|
|
$
|
805,995
|
|
|
Accrued interest included in total
|
$
|
1,915
|
|
$
|
52
|
|
$
|
11
|
|
$
|
—
|
|
$
|
1,978
|
|
For each of our mortgage and installment segment classes we generally monitor credit quality based on the credit scores of the borrowers. These credit scores are generally updated semi-annually. The following tables summarize credit scores by loan class for our mortgage and installment loan segments at December 31:
|
|
Mortgage (1)
|
|||||||||||||||||
|
|
1-4
Family |
Resort
Lending |
Home
Equity 1st Lien |
Home
Equity 2nd Lien |
Purchased
Loans |
Total
|
||||||||||||
|
|
(In thousands)
|
|||||||||||||||||
|
2017
|
|
|
|
|
|
|
|
|
|
|
|
|
|
|
|
|
|
|
|
800 and above
|
$
|
70,540
|
|
$
|
11,625
|
|
$
|
6,169
|
|
$
|
7,842
|
|
$
|
7,983
|
|
$
|
104,159
|
|
|
750-799
|
|
265,907
|
|
|
36,015
|
|
|
16,561
|
|
|
24,126
|
|
|
17,651
|
|
|
360,260
|
|
|
700-749
|
|
146,302
|
|
|
22,099
|
|
|
7,317
|
|
|
15,012
|
|
|
7,937
|
|
|
198,667
|
|
|
650-699
|
|
83,695
|
|
|
12,145
|
|
|
2,793
|
|
|
7,420
|
|
|
426
|
|
|
106,479
|
|
|
600-649
|
|
25,087
|
|
|
3,025
|
|
|
1,189
|
|
|
2,512
|
|
|
—
|
|
|
31,813
|
|
|
550-599
|
|
15,136
|
|
|
2,710
|
|
|
518
|
|
|
1,118
|
|
|
—
|
|
|
19,482
|
|
|
500-549
|
|
9,548
|
|
|
1,009
|
|
|
397
|
|
|
1,156
|
|
|
—
|
|
|
12,110
|
|
|
Under 500
|
|
2,549
|
|
|
269
|
|
|
260
|
|
|
385
|
|
|
—
|
|
|
3,463
|
|
|
Unknown
|
|
14,358
|
|
|
1,659
|
|
|
157
|
|
|
87
|
|
|
114
|
|
|
16,375
|
|
|
Total
|
$
|
633,122
|
|
$
|
90,556
|
|
$
|
35,361
|
|
$
|
59,658
|
|
$
|
34,111
|
|
$
|
852,808
|
|
|
Accrued interest included in total
|
$
|
2,361
|
|
$
|
371
|
|
$
|
157
|
|
$
|
294
|
|
$
|
95
|
|
$
|
3,278
|
|
|
|
|
|
|
|
|
|
|
|
|
|
|
|
|
|
|
|
|
|
|
2016
|
|
|
|
|
|
|
|
|
|
|
|
|
|
|
|
|
|
|
|
800 and above
|
$
|
36,534
|
|
$
|
10,484
|
|
$
|
6,048
|
|
$
|
8,392
|
|
$
|
8,462
|
|
$
|
69,920
|
|
|
750-799
|
|
102,382
|
|
|
41,999
|
|
|
10,006
|
|
|
20,113
|
|
|
20,984
|
|
|
195,484
|
|
|
700-749
|
|
69,337
|
|
|
24,727
|
|
|
5,706
|
|
|
12,360
|
|
|
9,115
|
|
|
121,245
|
|
|
650-699
|
|
50,621
|
|
|
13,798
|
|
|
4,106
|
|
|
8,167
|
|
|
437
|
|
|
77,129
|
|
|
600-649
|
|
25,270
|
|
|
5,769
|
|
|
1,674
|
|
|
3,067
|
|
|
—
|
|
|
35,780
|
|
|
550-599
|
|
13,747
|
|
|
3,030
|
|
|
455
|
|
|
1,699
|
|
|
—
|
|
|
18,931
|
|
|
500-549
|
|
9,215
|
|
|
1,438
|
|
|
486
|
|
|
981
|
|
|
—
|
|
|
12,120
|
|
|
Under 500
|
|
5,145
|
|
|
92
|
|
|
255
|
|
|
279
|
|
|
—
|
|
|
5,771
|
|
|
Unknown
|
|
2,290
|
|
|
1,711
|
|
|
280
|
|
|
179
|
|
|
139
|
|
|
4,599
|
|
|
Total
|
$
|
314,541
|
|
$
|
103,048
|
|
$
|
29,016
|
|
$
|
55,237
|
|
$
|
39,137
|
|
$
|
540,979
|
|
|
Accrued interest included in total
|
$
|
1,466
|
|
$
|
450
|
|
$
|
111
|
|
$
|
226
|
|
$
|
111
|
|
$
|
2,364
|
|
| (1) | Credit scores have been updated within the last twelve months. |
67
NOTES TO CONSOLIDATED FINANCIAL STATEMENTS — (Continued)
|
|
Installment (1)
|
|||||||||||||||||
|
|
Home
Equity 1st Lien |
Home
Equity 2nd Lien |
Boat Lending
|
Recreational
Vehicle Lending |
Other
|
Total
|
||||||||||||
|
|
(In thousands)
|
|||||||||||||||||
|
2017
|
|
|
|
|
|
|
|
|
|
|
|
|
|
|
|
|
|
|
|
800 and above
|
$
|
815
|
|
$
|
825
|
|
$
|
15,531
|
|
$
|
16,754
|
|
$
|
7,060
|
|
$
|
40,985
|
|
|
750-799
|
|
1,912
|
|
|
1,952
|
|
|
73,251
|
|
|
52,610
|
|
|
28,422
|
|
|
158,147
|
|
|
700-749
|
|
1,825
|
|
|
2,142
|
|
|
28,922
|
|
|
17,993
|
|
|
20,059
|
|
|
70,941
|
|
|
650-699
|
|
1,840
|
|
|
2,036
|
|
|
9,179
|
|
|
4,270
|
|
|
9,258
|
|
|
26,583
|
|
|
600-649
|
|
1,567
|
|
|
1,065
|
|
|
2,052
|
|
|
754
|
|
|
2,402
|
|
|
7,840
|
|
|
550-599
|
|
950
|
|
|
1,028
|
|
|
640
|
|
|
305
|
|
|
871
|
|
|
3,794
|
|
|
500-549
|
|
499
|
|
|
303
|
|
|
281
|
|
|
83
|
|
|
475
|
|
|
1,641
|
|
|
Under 500
|
|
32
|
|
|
88
|
|
|
57
|
|
|
6
|
|
|
194
|
|
|
377
|
|
|
Unknown
|
|
15
|
|
|
32
|
|
|
59
|
|
|
35
|
|
|
6,501
|
|
|
6,642
|
|
|
Total
|
$
|
9,455
|
|
$
|
9,471
|
|
$
|
129,972
|
|
$
|
92,810
|
|
$
|
75,242
|
|
$
|
316,950
|
|
|
Accrued interest included in total
|
$
|
39
|
|
$
|
43
|
|
$
|
346
|
|
$
|
254
|
|
$
|
241
|
|
$
|
923
|
|
|
|
|
|
|
|
|
|
|
|
|
|
|
|
|
|
|
|
|
|
|
2016
|
|
|
|
|
|
|
|
|
|
|
|
|
|
|
|
|
|
|
|
800 and above
|
$
|
1,354
|
|
$
|
1,626
|
|
$
|
21,422
|
|
$
|
23,034
|
|
$
|
8,911
|
|
$
|
56,347
|
|
|
750-799
|
|
2,478
|
|
|
3,334
|
|
|
50,508
|
|
|
35,827
|
|
|
21,918
|
|
|
114,065
|
|
|
700-749
|
|
1,920
|
|
|
2,686
|
|
|
20,045
|
|
|
11,049
|
|
|
13,183
|
|
|
48,883
|
|
|
650-699
|
|
2,852
|
|
|
2,541
|
|
|
7,559
|
|
|
3,205
|
|
|
8,913
|
|
|
25,070
|
|
|
600-649
|
|
1,691
|
|
|
1,775
|
|
|
1,846
|
|
|
821
|
|
|
2,269
|
|
|
8,402
|
|
|
550-599
|
|
1,231
|
|
|
1,063
|
|
|
882
|
|
|
280
|
|
|
833
|
|
|
4,289
|
|
|
500-549
|
|
981
|
|
|
692
|
|
|
440
|
|
|
189
|
|
|
511
|
|
|
2,813
|
|
|
Under 500
|
|
114
|
|
|
220
|
|
|
73
|
|
|
16
|
|
|
211
|
|
|
634
|
|
|
Unknown
|
|
29
|
|
|
21
|
|
|
150
|
|
|
114
|
|
|
5,570
|
|
|
5,884
|
|
|
Total
|
$
|
12,650
|
|
$
|
13,958
|
|
$
|
102,925
|
|
$
|
74,535
|
|
$
|
62,319
|
|
$
|
266,387
|
|
|
Accrued interest included in total
|
$
|
54
|
|
$
|
59
|
|
$
|
264
|
|
$
|
203
|
|
$
|
191
|
|
$
|
771
|
|
| (1) | Credit scores have been updated within the last twelve months. |
Mortgage loans serviced for others are not reported as assets on the Consolidated Statements of Financial Condition. The principal balances of these loans at December 31 follow:
|
|
2017
|
2016
|
||||
|
|
(In thousands)
|
|||||
|
Mortgage loans serviced for:
|
|
|
|
|
|
|
|
Fannie Mae
|
$
|
1,001,388
|
|
$
|
944,703
|
|
|
Freddie Mac
|
|
637,204
|
|
|
622,885
|
|
|
Ginnie Mae
|
|
130,284
|
|
|
85,290
|
|
|
FHLB
|
|
47,527
|
|
|
6,031
|
|
|
Other
|
|
34
|
|
|
84
|
|
|
Total
|
$
|
1,816,437
|
|
$
|
1,658,993
|
|
68
NOTES TO CONSOLIDATED FINANCIAL STATEMENTS — (Continued)
Custodial deposit accounts maintained in connection with mortgage loans serviced for others totaled $20.7 million and $18.9 million, at December 31, 2017 and 2016, respectively.
If we do not remain well capitalized for regulatory purposes (see note #20), meet certain minimum capital levels or certain profitability requirements or if we incur a rapid decline in net worth, we could lose our ability to sell and/or service loans to these investors. This could impact our ability to generate gains on the sale of loans and generate servicing income. A forced liquidation of our servicing portfolio could also impact the value that could be recovered on this asset. Fannie Mae has the most stringent eligibility requirements covering capital levels, profitability and decline in net worth. Fannie Mae requires seller/servicers to be well capitalized for regulatory purposes. For the profitability requirement, we cannot record four or more consecutive quarterly losses and experience a 30% decline in net worth over the same period. Our net worth cannot decline by more than 25% in one quarter or more than 40% over two consecutive quarters. The highest level of capital we are required to maintain is at least $2.5 million plus 0.25% of all loans serviced for others.
An analysis of capitalized mortgage loan servicing rights for the years ended December 31 follows:
|
|
2017
|
2016
|
2015
|
||||||
|
|
(In thousands)
|
||||||||
|
Balance at beginning of period
|
$
|
13,671
|
|
$
|
12,436
|
|
$
|
12,106
|
|
|
Change in accounting (see note #1)
|
|
542
|
|
|
—
|
|
|
—
|
|
|
Balance at beginning of period, as adjusted
|
$
|
14,213
|
|
$
|
12,436
|
|
$
|
12,106
|
|
|
Originated servicing rights capitalized
|
|
4,230
|
|
|
3,119
|
|
|
2,697
|
|
|
Amortization
|
|
—
|
|
|
(2,850
|
)
|
|
(2,868
|
)
|
|
Change in valuation allowance
|
|
—
|
|
|
966
|
|
|
501
|
|
|
Change in fair value due to price
|
|
(718
|
)
|
|
—
|
|
|
—
|
|
|
Change in fair value due to pay downs
|
|
(2,026
|
)
|
|
—
|
|
|
—
|
|
|
Balance at end of year
|
$
|
15,699
|
|
$
|
13,671
|
|
$
|
12,436
|
|
|
Valuation allowance
|
$
|
—
|
|
$
|
2,306
|
|
$
|
3,272
|
|
|
Loans sold and serviced that have had servicing rights capitalized
|
$
|
1,815,668
|
|
$
|
1,657,996
|
|
$
|
1,643,086
|
|
The fair value of capitalized mortgage loan servicing rights was $15.7 million and $14.2 million at December 31, 2017 and 2016, respectively. Fair value was determined using an average coupon rate of 4.17%, average servicing fee of 0.258%, average discount rate of 10.11% and an average Public Securities Association (“PSA”) prepayment rate of 169 for December 31, 2017; and an average coupon rate of 4.20%, average servicing fee of 0.256%, average discount rate of 10.07% and an average PSA prepayment rate of 175 for December 31, 2016.
NOTE 5 – OTHER REAL ESTATE
A summary of other real estate activity for the years ended December 31 follows (1):
|
|
2017
|
2016
|
2015
|
||||||
|
|
(In thousands)
|
||||||||
|
Balance at beginning of year, net of valuation allowance
|
$
|
4,956
|
|
$
|
7,070
|
|
$
|
6,370
|
|
|
Loans transferred to other real estate
|
|
1,735
|
|
|
2,355
|
|
|
6,694
|
|
|
Sales of other real estate
|
|
(4,737
|
)
|
|
(3,596
|
)
|
|
(5,502
|
)
|
|
Additions to valuation allowance charged to expense
|
|
(326
|
)
|
|
(873
|
)
|
|
(492
|
)
|
|
Balance at end of year, net of valuation allowance
|
$
|
1,628
|
|
$
|
4,956
|
|
$
|
7,070
|
|
| (1) | Table excludes other repossessed assets totaling $0.02 and $0.05 million at December 31, 2017 and 2016, respectively. |
69
NOTES TO CONSOLIDATED FINANCIAL STATEMENTS — (Continued)
We periodically review our real estate properties and establish valuation allowances on these properties if values have declined since the date of acquisition. An analysis of our valuation allowance for other real estate follows:
|
|
2017
|
2016
|
2015
|
||||||
|
|
(In thousands)
|
||||||||
|
Balance at beginning of year
|
$
|
793
|
|
$
|
1,692
|
|
$
|
2,511
|
|
|
Additions charged to expense
|
|
326
|
|
|
873
|
|
|
492
|
|
|
Direct write-downs upon sale
|
|
(996
|
)
|
|
(1,772
|
)
|
|
(1,311
|
)
|
|
Balance at end of year
|
$
|
123
|
|
$
|
793
|
|
$
|
1,692
|
|
At December 31, 2017 and 2016, the balance of other real estate includes $1.6 million and $1.9 million of foreclosed residential real estate properties. Retail mortgage loans secured by residential real estate properties for which formal foreclosure proceedings are in process according to local requirements totaled $0.8 million and $1.0 million at December 31, 2017 and 2016, respectively.
Other real estate and repossessed assets totaling $1.6 million and $5.0 million at December 31, 2017 and 2016, respectively, are presented net of the valuation allowance on the Consolidated Statements of Financial Condition.
NOTE 6 – PROPERTY AND EQUIPMENT
A summary of property and equipment at December 31 follows:
|
|
2017
|
2016
|
||||
|
|
(In thousands)
|
|||||
|
Land
|
$
|
16,199
|
|
$
|
15,486
|
|
|
Buildings
|
|
55,434
|
|
|
54,656
|
|
|
Equipment
|
|
69,604
|
|
|
72,090
|
|
|
|
|
141,237
|
|
|
142,232
|
|
|
Accumulated depreciation and amortization
|
|
(102,088
|
)
|
|
(102,057
|
)
|
|
Property and equipment, net
|
$
|
39,149
|
|
$
|
40,175
|
|
Depreciation expense was $5.3 million, $5.8 million and $6.6 million in 2017, 2016 and 2015, respectively.
NOTE 7 – INTANGIBLE ASSETS
Intangible assets, net of amortization, at December 31 follows:
|
|
2017
|
2016
|
||||||||||
|
|
Gross
Carrying Amount |
Accumulated
Amortization |
Gross
Carrying Amount |
Accumulated
Amortization |
||||||||
|
|
(In thousands)
|
|||||||||||
|
Amortized intangible assets - core deposits
|
$
|
6,118
|
|
$
|
4,532
|
|
$
|
6,118
|
|
$
|
4,186
|
|
Intangible amortization expense was $0.3 million in each of 2017, 2016 and 2015, respectively.
A summary of estimated core deposit intangible amortization at December 31, 2017, follows:
|
|
(In thousands)
|
||
|
2018
|
$
|
346
|
|
|
2019
|
|
346
|
|
|
2020
|
|
346
|
|
|
2021
|
|
346
|
|
|
2022
|
|
202
|
|
|
Total
|
$
|
1,586
|
|
70
NOTES TO CONSOLIDATED FINANCIAL STATEMENTS — (Continued)
NOTE 8 – DEPOSITS
A summary of interest expense on deposits for the years ended December 31 follows:
|
|
2017
|
2016
|
2015
|
||||||
|
|
(In thousands)
|
||||||||
|
Savings and interest bearing checking
|
$
|
1,530
|
|
$
|
1,115
|
|
$
|
1,056
|
|
|
Time deposits under $100,000
|
|
1,594
|
|
|
1,628
|
|
|
1,586
|
|
|
Time deposits of $100,000 or more
|
|
3,651
|
|
|
2,198
|
|
|
1,367
|
|
|
Total
|
$
|
6,775
|
|
$
|
4,941
|
|
$
|
4,009
|
|
Aggregate time deposits in denominations of $250,000 or more amounted to $92.2 million and $174.6 million at December 31, 2017 and 2016, respectively.
A summary of the maturity of time deposits at December 31, 2017, follows:
|
|
(In thousands)
|
||
|
2018
|
$
|
446,835
|
|
|
2019
|
|
65,810
|
|
|
2020
|
|
15,595
|
|
|
2021
|
|
17,275
|
|
|
2022
|
|
8,761
|
|
|
2023 and thereafter
|
|
542
|
|
|
Total
|
$
|
554,818
|
|
Reciprocal deposits represent demand, money market and time deposits from our customers that have been placed through Promontory Interfinancial Network’s Insured Cash Sweep® service and Certificate of Deposit Account Registry Service®. These services allow our customers to access multi-million dollar FDIC deposit insurance on deposit balances greater than the standard FDIC insurance maximum.
A summary of reciprocal deposits at December 31 follows:
|
|
2017
|
2016
|
||||
|
|
(In thousands)
|
|||||
|
Demand
|
$
|
10,146
|
|
$
|
3,055
|
|
|
Money market
|
|
2,846
|
|
|
4,350
|
|
|
Time
|
|
37,987
|
|
|
31,252
|
|
|
Total
|
$
|
50,979
|
|
$
|
38,657
|
|
NOTE 9 – OTHER BORROWINGS
A summary of other borrowings at December 31 follows:
|
|
2017
|
2016
|
||||
|
|
(In thousands)
|
|||||
|
Advances from the FHLB
|
$
|
47,841
|
|
$
|
9,428
|
|
|
Federal funds purchased
|
|
6,750
|
|
|
—
|
|
|
Other
|
|
9
|
|
|
5
|
|
|
Total
|
$
|
54,600
|
|
$
|
9,433
|
|
Advances from the FHLB are secured by unencumbered qualifying mortgage and home equity loans with a market value equal to at least 132% to 165%, respectively, of outstanding advances. Advances are also secured by FHLB stock that we own, which totaled $7.8 million at December 31, 2017. Unused borrowing capacity with the
71
NOTES TO CONSOLIDATED FINANCIAL STATEMENTS — (Continued)
FHLB (subject to the FHLB’s credit requirements and policies) was $304.5 million at December 31, 2017. Interest expense on advances amounted to $0.9 million, $0.8 million and $0.8 million for the years ended December 31, 2017, 2016 and 2015, respectively. No FHLB advances were terminated during 2017, 2016 or 2015.
As a member of the FHLB, we must own FHLB stock equal to the greater of 0.75% of the unpaid principal balance of residential mortgage loans or 4.5% of our outstanding advances. At December 31, 2017, we were in compliance with the FHLB stock ownership requirements.
The maturity dates and weighted average interest rates of FHLB advances at December 31 follow:
|
|
2017
|
2016
|
||||||||||
|
|
Amount
|
Rate
|
Amount
|
Rate
|
||||||||
|
|
(Dollars in thousands)
|
|||||||||||
|
Fixed-rate advances
|
|
|
|
|
|
|
|
|
|
|
|
|
|
2017
|
|
|
|
|
|
|
$
|
1,192
|
|
|
7.04
|
%
|
|
2018
|
$
|
19,910
|
|
|
2.43
|
%
|
|
5,183
|
|
|
5.99
|
|
|
2019
|
|
10,000
|
|
|
1.60
|
|
|
—
|
|
|
|
|
|
2020
|
|
7,931
|
|
|
3.80
|
|
|
3,053
|
|
|
7.49
|
|
|
Total fixed-rate advances
|
|
37,841
|
|
|
2.50
|
|
|
9,428
|
|
|
6.61
|
|
|
Variable-rate advances - 2018
|
|
10,000
|
|
|
1.67
|
|
|
—
|
|
|
|
|
|
Total advances
|
$
|
47,841
|
|
|
2.33
|
%
|
$
|
9,428
|
|
|
6.61
|
%
|
A summary of contractually required repayments of FHLB advances at December 31, 2017 follow:
|
|
(In thousands)
|
||
|
2018
|
$
|
30,042
|
|
|
2019
|
|
10,143
|
|
|
2020
|
|
7,656
|
|
|
Total
|
$
|
47,841
|
|
Borrowings with the FRB at December 31, 2017 and 2016 were zero. Average borrowings with the FRB during the years ended December 31, 2017, 2016 and 2015 totaled $0.05 million, zero and zero. We had unused borrowing capacity with the FRB (subject to the FRB’s credit requirements and policies) of $441.2 million at December 31, 2017. Collateral for FRB borrowings are certain commercial loans.
Interest expense on federal funds purchased totaled $0.1 million, zero and zero for the years ended December 31, 2017, 2016 and 2015.
Assets, consisting of FHLB stock and loans, pledged to secure other borrowings and unused borrowing capacity totaled $1.184 billion at December 31, 2017.
NOTE 10 – SUBORDINATED DEBENTURES
We have formed various special purpose entities (the “trusts”) for the purpose of issuing trust preferred securities in either public or pooled offerings or in private placements. Independent Bank Corporation owns all of the common stock of each trust and has issued subordinated debentures to each trust in exchange for all of the proceeds from the issuance of the common stock and the trust preferred securities. Trust preferred securities totaling $34.5 million at both December 31, 2017 and 2016, respectively, qualified as Tier 1 regulatory capital.
These trusts are not consolidated with Independent Bank Corporation and accordingly, we report the common securities of the trusts held by us in accrued income and other assets and the subordinated debentures that we have issued to the trusts in the liability section of our Consolidated Statements of Financial Condition.
72
NOTES TO CONSOLIDATED FINANCIAL STATEMENTS — (Continued)
Summary information regarding subordinated debentures as of December 31 follows:
|
|
|
2017 and 2016
|
||||||||
|
Entity Name
|
Issue
Date |
Subordinated
Debentures |
Trust
Preferred Securities Issued |
Common
Stock Issued |
||||||
|
|
|
(In thousands)
|
||||||||
|
IBC Capital Finance III
|
May 2007
|
$
|
12,372
|
|
$
|
12,000
|
|
$
|
372
|
|
|
IBC Capital Finance IV
|
September 2007
|
|
15,465
|
|
|
15,000
|
|
|
465
|
|
|
Midwest Guaranty Trust I
|
November 2002
|
|
7,732
|
|
|
7,500
|
|
|
232
|
|
|
|
|
$
|
35,569
|
|
$
|
34,500
|
|
$
|
1,069
|
|
Other key terms for the subordinated debentures and trust preferred securities that were outstanding at December 31, 2017 and 2016 follow:
|
Entity Name
|
Maturity
Date |
Interest Rate
|
First Permitted
Redemption Date |
|
IBC Capital Finance III
|
July 30, 2037
|
3 month LIBOR plus 1.60%
|
July 30, 2012
|
|
IBC Capital Finance IV
|
September 15, 2037
|
3 month LIBOR plus 2.85%
|
September 15, 2012
|
|
Midwest Guaranty Trust I
|
November 7, 2032
|
3 month LIBOR plus 3.45%
|
November 7, 2007
|
The subordinated debentures and trust preferred securities are cumulative and have a feature that permits us to defer distributions (payment of interest) from time to time for a period not to exceed 20 consecutive quarters. Interest is payable quarterly on each of the subordinated debentures and trust preferred securities and no distributions were deferred at December 31, 2017 and 2016.
We have the right to redeem the subordinated debentures and trust preferred securities (at par) in whole or in part from time to time on or after the first permitted redemption date specified above or upon the occurrence of specific events defined within the trust indenture agreements.
Issuance costs have been capitalized and are being amortized on a straight- line basis over a period not exceeding 30 years and are included in interest expense in the Consolidated Statements of Operations. Distributions (payment of interest) on the trust preferred securities are also included in interest expense – other borrowings and subordinated debentures in the Consolidated Statements of Operations.
NOTE 11 – COMMITMENTS AND CONTINGENT LIABILITIES
In the normal course of business, we enter into financial instruments with off-balance sheet risk to meet the financing needs of customers or to reduce exposure to fluctuations in interest rates. These financial instruments may include commitments to extend credit and standby letters of credit. Financial instruments involve varying degrees of credit and interest-rate risk in excess of amounts reflected in the Consolidated Statements of Financial Condition. Exposure to credit risk in the event of non-performance by the counterparties to the financial instruments for loan commitments to extend credit and standby letters of credit is represented by the contractual amounts of those instruments. We do not, however, anticipate material losses as a result of these financial instruments.
A summary of financial instruments with off-balance sheet risk at December 31 follows:
|
|
2017
|
2016
|
||||
|
|
(In thousands)
|
|||||
|
Financial instruments whose risk is represented by contract amounts
|
|
|
|
|
|
|
|
Commitments to extend credit
|
$
|
439,663
|
|
$
|
364,270
|
|
|
Standby letters of credit
|
|
4,596
|
|
|
3,140
|
|
73
NOTES TO CONSOLIDATED FINANCIAL STATEMENTS — (Continued)
Commitments to extend credit are agreements to lend to a customer as long as there is no violation of any condition established in the contract. Commitments generally have fixed expiration dates or other termination clauses and generally require payment of a fee. Since commitments may expire without being drawn upon, the commitment amounts do not represent future cash requirements. Commitments are issued subject to similar underwriting standards, including collateral requirements, as are generally involved in the extension of credit facilities.
Standby letters of credit are written conditional commitments issued to guarantee the performance of a customer to a third party. The credit risk involved in such transactions is essentially the same as that involved in extending loan facilities and, accordingly, standby letters of credit are issued subject to similar underwriting standards, including collateral requirements, as are generally involved in the extension of credit facilities. The majority of the standby letters of credit are to corporations, have variable rates that range from 3.75% to 7.50% and mature through 2019.
In the fourth quarter of 2016, we reached a tentative settlement regarding litigation initiated against the Bank in Wayne County, Michigan Circuit Court. The Court issued a preliminary approval of this settlement in the first quarter of 2017 and a final approval of this settlement in January 2018. This litigation concerned the Bank’s checking account transaction sequencing during a period from February 2009 to June 2011. Under the terms of the settlement, we agreed to pay $2.2 million and we are also responsible for class notification costs and certain other expenses which are estimated to total approximately $0.1 million. The $2.2 million was paid in January 2018. We recorded a $2.3 million expense in the fourth quarter of 2016 for this settlement. Although, we deny any liability associated with this matter and believe we have meritorious defenses to the allegations in the complaint, given the costs and uncertainty of litigation, we determined that this settlement was in the best interests of the organization.
We are also involved in various other litigation matters in the ordinary course of business. At the present time, we do not believe any of these matters will have a significant impact on our consolidated financial position or results of operations. The aggregate amount we have accrued for losses we consider probable as a result of these other litigation matters is immaterial. However, because of the inherent uncertainty of outcomes from any litigation matter, we believe it is reasonably possible we may incur losses in addition to the amounts we have accrued. At this time, we estimate the maximum amount of additional losses that are reasonably possible is insignificant. However, because of a number of factors, including the fact that certain of these litigation matters are still in their early stages, this maximum amount may change in the future.
The litigation matters described in the preceding paragraph primarily include claims that have been brought against us for damages, but do not include litigation matters where we seek to collect amounts owed to us by third parties (such as litigation initiated to collect delinquent loans). These excluded, collection-related matters may involve claims or counterclaims by the opposing party or parties, but we have excluded such matters from the disclosure contained in the preceding paragraph in all cases where we believe the possibility of us paying damages to any opposing party is remote. Risks associated with the likelihood that we will not collect the full amount owed to us, net of reserves, are disclosed elsewhere in this report.
In connection with the sale of Mepco (see notes #1 and #26), we agreed to contractually indemnify the purchaser from certain losses it may incur, including as a result of its failure to collect certain receivables it purchased as part of the business as well as breaches of representations and warranties we made in the sale agreement, subject to various limitations. We have not accrued any liability related to these indemnification requirements in our December 31, 2017 Consolidated Statement of Financial Condition because we believe the likelihood of having to pay any amount as a result of these indemnification obligations is remote. However, if the purchaser is unable to collect the receivables it purchased from Mepco or otherwise encounters difficulties in operating the business, it is possible it could make one or more claims against us pursuant to the sale agreement. In that event, we may incur expenses in defending any such claims and/or amounts paid to such purchaser to resolve such claims. As of December 31, 2017 these receivables balances had declined to $13.7 million and to date, the purchaser has made no claims for indemnification.
The provision for loss reimbursement on sold loans represents our estimate of incurred losses related to mortgage loans that we have sold to investors (primarily Fannie Mae, Freddie Mac, Ginnie Mae and the FHLB). Since we sell mortgage loans without recourse, loss reimbursements only occur in those instances where we have breached a representation or warranty or other contractual requirement related to the loan sale. The provision for loss reimbursement on sold loans was an expense (credit) of $0.17 million, $0.03 million and $(0.06) million for the years ended December 31, 2017, 2016 and 2015, respectively. The reserve for loss reimbursements on sold mortgage loans
74
NOTES TO CONSOLIDATED FINANCIAL STATEMENTS — (Continued)
totaled $0.7 million and $0.6 million at December 31, 2017 and 2016, respectively. This reserve is included in accrued expenses and other liabilities in our Consolidated Statements of Financial Condition. This reserve is based on an analysis of mortgage loans that we have sold which are further categorized by delinquency status, loan to value, and year of origination. The calculation includes factors such as probability of default, probability of loss reimbursement (breach of representation or warranty) and estimated loss severity. We believe that the amounts that we have accrued for incurred losses on sold mortgage loans are appropriate given our analyses. However, future losses could exceed our current estimate.
NOTE 12 – SHAREHOLDERS’ EQUITY AND INCOME PER COMMON SHARE
In January, 2017, 2016 and 2015, our Board of Directors authorized share repurchase plans to buy back up to 5% of our outstanding common stock through the end of each respective year. In addition, on April 26, 2016 our Board of Directors authorized a $5.0 million expansion of the 2016 repurchase plan. During 2017, 2016 and 2015 repurchases were made through open market transactions and totaled zero, 1,153,136 and 967,199 shares of common stock, respectively for an aggregate purchase price of zero, $16.9 million and $13.5 million, respectively.
A reconciliation of basic and diluted net income per common share for the years ended December 31 follows:
|
|
2017
|
2016
|
2015
|
||||||
|
|
(In thousands, except per share amounts)
|
||||||||
|
Net income
|
$
|
20,475
|
|
$
|
22,766
|
|
$
|
20,017
|
|
|
|
|
|
|
|
|
|
|
|
|
|
Weighted average shares outstanding (1)
|
|
21,327
|
|
|
21,378
|
|
|
22,716
|
|
|
Effect of stock options
|
|
142
|
|
|
151
|
|
|
119
|
|
|
Stock units for deferred compensation plan for non-employee directors
|
|
121
|
|
|
115
|
|
|
112
|
|
|
Performance share units
|
|
60
|
|
|
48
|
|
|
—
|
|
|
Restricted stock units
|
|
—
|
|
|
35
|
|
|
233
|
|
|
Weighted average shares outstanding for calculation of diluted earnings per share
|
|
21,650
|
|
|
21,727
|
|
|
23,180
|
|
|
|
|
|
|
|
|
|
|
|
|
|
Net income per common share
|
|
|
|
|
|
|
|
|
|
|
Basic (1)
|
$
|
0.96
|
|
$
|
1.06
|
|
$
|
0.88
|
|
|
Diluted
|
$
|
0.95
|
|
$
|
1.05
|
|
$
|
0.86
|
|
| (1) | Basic net income per common share includes weighted average common shares outstanding during the period and participating share awards. |
Weighted average stock options outstanding that were not considered in computing diluted net income per common share because they were anti-dilutive totaled zero, zero and 0.03 million for 2017, 2016 and 2015, respectively.
NOTE 13 – INCOME TAX
The composition of income tax expense for the years ended December 31 follows:
|
|
2017
|
2016
|
2015
|
||||||
|
|
(In thousands)
|
||||||||
|
Current expense
|
$
|
1,927
|
|
$
|
362
|
|
$
|
200
|
|
|
Deferred expense
|
|
10,071
|
|
|
9,756
|
|
|
9,128
|
|
|
Change in statutory rate
|
|
5,965
|
|
|
—
|
|
|
—
|
|
|
Valuation allowance - change in estimate
|
|
—
|
|
|
17
|
|
|
35
|
|
|
Income tax expense
|
$
|
17,963
|
|
$
|
10,135
|
|
$
|
9,363
|
|
75
NOTES TO CONSOLIDATED FINANCIAL STATEMENTS — (Continued)
The deferred income tax expense of $10.1 million in 2017 can be primarily attributed to the utilization of our net operating loss (“NOL”) carryfoward while the deferred income tax expense of $9.8 million and $9.1 million during 2016 and 2015, respectively can be primarily attributed to the utilization of our NOL carryfoward and decrease in our AFLL.
On December 22, 2017, President Donald Trump signed into law “H.R. 1”, also known as the “Tax Cuts and Jobs Act”, which among other things, reduced the federal corporate income tax rate to 21% effective January 1, 2018. As a result, we concluded that our deferred tax assets, net had to be remeasured. Our deferred tax assets, net represents expected corporate tax benefits anticipated to be realized in the future. The reduction in the federal corporate income tax rate reduces these anticipated future benefits. The remeasurement of our deferred tax assets, net at December 31, 2017 resulted in a reduction of these net assets and a corresponding increase in income tax expense of $6.0 million that was recorded in the fourth quarter of 2017.
A reconciliation of income tax expense to the amount computed by applying the statutory federal income tax rate of 35% in each year presented to the income before income tax for the years ended December 31 follows:
|
|
2017
|
2016
|
2015
|
||||||
|
|
(In thousands)
|
||||||||
|
Statutory rate applied to income before income tax
|
$
|
13,453
|
|
$
|
11,515
|
|
$
|
10,283
|
|
|
Change in statutory rate
|
|
5,965
|
|
|
—
|
|
|
—
|
|
|
Tax-exempt income
|
|
(777
|
)
|
|
(534
|
)
|
|
(434
|
)
|
|
Bank owned life insurance
|
|
(372
|
)
|
|
(477
|
)
|
|
(449
|
)
|
|
Share-based compensation
|
|
(287
|
)
|
|
(348
|
)
|
|
—
|
|
|
Unrecognized tax benefit
|
|
(123
|
)
|
|
(155
|
)
|
|
(135
|
)
|
|
Non-deductible meals, entertainment and memberships
|
|
64
|
|
|
46
|
|
|
43
|
|
|
Net change in valuation allowance
|
|
—
|
|
|
17
|
|
|
35
|
|
|
Other, net
|
|
40
|
|
|
71
|
|
|
20
|
|
|
Income tax expense
|
$
|
17,963
|
|
$
|
10,135
|
|
$
|
9,363
|
|
The tax effects of temporary differences that give rise to significant portions of the deferred tax assets and deferred tax liabilities at December 31 follow:
|
|
2017
|
2016
|
||||
|
|
(In thousands)
|
|||||
|
Deferred tax assets
|
|
|
|
|
|
|
|
Alternative minimum tax credit carry forward
|
$
|
6,113
|
|
$
|
4,064
|
|
|
Allowance for loan losses
|
|
4,743
|
|
|
7,104
|
|
|
Loss carryforwards
|
|
3,752
|
|
|
17,131
|
|
|
Property and equipment
|
|
1,686
|
|
|
3,143
|
|
|
Purchase premiums, net
|
|
699
|
|
|
1,460
|
|
|
Share based payments
|
|
677
|
|
|
1,011
|
|
|
Litigation settlement
|
|
477
|
|
|
805
|
|
|
Unrealized loss on trading securities
|
|
283
|
|
|
486
|
|
|
Reserve for unfunded lending commitments
|
|
236
|
|
|
228
|
|
|
Deferred compensation
|
|
229
|
|
|
375
|
|
|
Other than temporary impairment charge on securities available for sale
|
|
210
|
|
|
400
|
|
|
Non accrual loan interest income
|
|
176
|
|
|
246
|
|
|
Loss reimbursement on sold loans reserve
|
|
140
|
|
|
196
|
|
|
Unrealized loss on securities available for sale
|
|
125
|
|
|
1,782
|
|
|
Vehicle service contract counterparty contingency reserve
|
|
117
|
|
|
500
|
|
|
Valuation allowance on other real estate
|
|
26
|
|
|
277
|
|
|
Other
|
|
123
|
|
|
1
|
|
|
Gross deferred tax assets
|
|
19,812
|
|
|
39,209
|
|
|
Valuation allowance
|
|
—
|
|
|
(1,071
|
)
|
|
Gross deferred tax assets net of valuation allowance
|
|
19,812
|
|
|
38,138
|
|
76
NOTES TO CONSOLIDATED FINANCIAL STATEMENTS — (Continued)
|
|
2017
|
2016
|
||||
|
|
(In thousands)
|
|||||
|
Deferred tax liabilities
|
|
|
|
|
|
|
|
Capitalized mortgage loan servicing rights
|
|
3,297
|
|
|
4,785
|
|
|
Deferred loan fees
|
|
1,327
|
|
|
490
|
|
|
Unrealized gain on derivative financial instruments
|
|
72
|
|
|
—
|
|
|
Federal Home Loan Bank stock
|
|
27
|
|
|
45
|
|
|
Gross deferred tax liabilities
|
|
4,723
|
|
|
5,320
|
|
|
Deferred tax assets, net
|
$
|
15,089
|
|
$
|
32,818
|
|
We assess whether a valuation allowance should be established against our deferred tax assets based on the consideration of all available evidence using a “more likely than not” standard. The ultimate realization of this asset is primarily based on generating future income. We concluded at both December 31, 2017 and 2016, that the realization of substantially all of our deferred tax assets continues to be more likely than not.
We had maintained a valuation allowance against our deferred tax assets of approximately $1.1 million at December 31, 2016. This valuation allowance on our deferred tax assets related to state income taxes at Mepco. In this instance, we determined that the future realization of these particular deferred tax assets was not more likely than not. That conclusion was based on the pending sale of Mepco’s payment plan business. After accounting for the May 2017 sale of our payment plan business, all that remained of these deferred tax assets were loss carryforwards that we wrote off against the related valuation allowance during the second quarter of 2017 as we will no longer be doing business in those states.
Because of our NOL and tax credit carryforwards, we are still subject to the rules of Section 382 of the Internal Revenue Code of 1986, as amended. An ownership change, as defined by these rules, would negatively affect our ability to utilize our NOL carryforwards and other deferred tax assets in the future. If such an ownership change were to occur, we may suffer higher-than-anticipated tax expense, and consequently lower net income and cash flow, in those future years.
At December 31, 2017, we had federal NOL carryforwards of approximately $17.9 million which, if not used against taxable income, will expire in 2032. In addition to this amount we also had $6.1 million of alternative minimum tax credit carryforwards with indefinite lives at December 31, 2017.
Changes in unrecognized tax benefits for the years ended December 31 follow:
|
|
2017
|
2016
|
2015
|
||||||
|
|
(In thousands)
|
||||||||
|
Balance at beginning of year
|
$
|
840
|
|
$
|
976
|
|
$
|
1,091
|
|
|
Additions based on tax positions related to the current year
|
|
7
|
|
|
19
|
|
|
20
|
|
|
Reductions due to the statute of limitations
|
|
(123
|
)
|
|
(155
|
)
|
|
(135
|
)
|
|
Reductions due to settlements
|
|
—
|
|
|
—
|
|
|
—
|
|
|
Balance at end of year
|
$
|
724
|
|
$
|
840
|
|
$
|
976
|
|
If recognized, the entire amount of unrecognized tax benefits, net of $0.15 million of federal tax on state benefits, would affect our effective tax rate. We do not expect the total amount of unrecognized tax benefits to significantly increase or decrease in the next twelve months. No amounts were expensed for interest and penalties for the years ended December 31, 2017, 2016 and 2015. No amounts were accrued for interest and penalties at December 31, 2017, 2016 or 2015. At December 31, 2017, U.S. Federal tax years 2014 through the present remain open to examination.
77
NOTES TO CONSOLIDATED FINANCIAL STATEMENTS — (Continued)
NOTE 14 – SHARE BASED COMPENSATION AND BENEFIT PLANS
We maintain share based payment plans that include a non-employee director stock purchase plan and a long-term incentive plan that permits the issuance of share based compensation, including stock options and non-vested share awards. The long-term incentive plan, which is shareholder approved, permits the grant of additional share based awards for up to 0.5 million shares of common stock as of December 31, 2017. The non-employee director stock purchase plan permits the grant of additional share based payments for up to 0.2 million shares of common stock as of December 31, 2017. Share based awards and payments are measured at fair value at the date of grant and are expensed over the requisite service period. Common shares issued upon exercise of stock options come from currently authorized but unissued shares.
During 2017, 2016 and 2015 pursuant to our long-term incentive plan, we granted 0.05 million, 0.10 million and 0.07 million shares, respectively of restricted stock and 0.02 million, 0.05 million and 0.03 million performance stock units (“PSUs”), respectively to certain officers. The shares of restricted stock issued during 2017 and 2015 cliff vest after a period of three years and the shares of restricted stock issued during 2016 cliff vest after periods ranging from one to four years. The PSUs issued during 2017 and 2015 cliff vest after a period of three years and the PSUs issued during 2016 cliff vest after periods ranging from three to five years. The performance feature of the PSUs is based on a comparison of our total shareholder return over the vesting period starting on the grant date to the total shareholder return over that period for a banking index of our peers.
Our directors may elect to receive at least a portion of their quarterly cash retainer fees in the form of common stock (either on a current basis or on a deferred basis) pursuant to the non-employee director stock purchase plan referenced above. Shares equal in value to that portion of each director’s fees that he or she has elected to receive in stock are issued each quarter and vest immediately. We issued 0.01 million shares to directors during each of the years ending 2017, 2016 and 2015 and expensed their value during those same periods.
Total compensation expense recognized for grants pursuant to our long-term incentive plan was $1.6 million, $1.5 million and $1.4 million in 2017, 2016 and 2015, respectively. The corresponding tax benefit relating to this expense was $0.6 million, $0.5 million and $0.5 million in 2017, 2016 and 2015, respectively. Total expense recognized for non-employee director share based payments was $0.2 million, $0.1 million and $0.1 million in 2017, 2016 and 2015, respectively. The corresponding tax benefit relating to this expense was $0.06 million, $0.04 million and $0.03 million in 2017, 2016 and 2015, respectively.
At December 31, 2017, the total expected compensation cost related to non-vested restricted stock and PSUs not yet recognized was $1.9 million. The weighted-average period over which this amount will be recognized is 2.1 years.
A summary of outstanding stock option grants and related transactions follows:
|
|
Number of
Shares |
Average
Exercise Price |
Weighted-
Average Remaining Contractual Term (Years) |
Aggregated
Intrinsic Value |
||||||||
|
|
|
|
|
(In thousands)
|
||||||||
|
Outstanding at January 1, 2017
|
|
211,018
|
|
$
|
5.05
|
|
|
|
|
|
|
|
|
Granted
|
|
—
|
|
|
|
|
|
|
|
|
|
|
|
Exercised
|
|
(34,963
|
)
|
|
4.07
|
|
|
|
|
|
|
|
|
Forfeited
|
|
—
|
|
|
|
|
|
|
|
|
|
|
|
Expired
|
|
—
|
|
|
|
|
|
|
|
|
|
|
|
Outstanding at December 31, 2017
|
|
176,055
|
|
$
|
5.24
|
|
|
4.07
|
|
$
|
3,012
|
|
|
Vested and expected to vest at
|
|
|
|
|
|
|
|
|
|
|
|
|
|
December 31, 2017
|
|
176,055
|
|
$
|
5.24
|
|
|
4.07
|
|
$
|
3,012
|
|
|
Exercisable at December 31, 2017
|
|
176,055
|
|
$
|
5.24
|
|
|
4.07
|
|
$
|
3,012
|
|
78
NOTES TO CONSOLIDATED FINANCIAL STATEMENTS — (Continued)
A summary of outstanding non-vested stock and related transactions follows:
|
|
Number
of Shares |
Weighted-
Average Grant Date Fair Value |
||||
|
Outstanding at January 1, 2017
|
|
296,422
|
|
$
|
14.52
|
|
|
Granted
|
|
68,473
|
|
|
21.07
|
|
|
Vested
|
|
(63,799
|
)
|
|
14.91
|
|
|
Forfeited
|
|
(10,569
|
)
|
|
15.66
|
|
|
Outstanding at December 31, 2017
|
|
290,527
|
|
$
|
15.88
|
|
Certain information regarding options exercised during the periods ending December 31 follows:
|
|
2017
|
2016
|
2015
|
||||||
|
|
(In thousands)
|
||||||||
|
Intrinsic value
|
$
|
623
|
|
$
|
254
|
|
$
|
444
|
|
|
Cash proceeds received
|
$
|
142
|
|
$
|
85
|
|
$
|
137
|
|
|
Tax benefit realized
|
$
|
218
|
|
$
|
89
|
|
$
|
155
|
|
We maintain 401(k) and employee stock ownership plans covering substantially all of our full-time employees. During 2017, 2016 and 2015, we matched 50% of employee contributions to the 401(k) plan up to a maximum of 6%, 6% and 4% of participating employees’ eligible wages, respectively. Contributions to the employee stock ownership plan are determined annually and require approval of our Board of Directors. The maximum contribution is 6% of employees’ eligible wages. Contributions to the employee stock ownership plan were 2% for 2017, 2016 and 2015. Amounts expensed for these retirement plans were $1.6 million, $1.4 million, and $1.2 million in 2017, 2016 and 2015, respectively.
Our employees participate in various performance-based compensation plans. Amounts expensed for all incentive plans totaled $8.0 million, $6.2 million and $5.7 million, in 2017, 2016 and 2015, respectively.
We also provide certain health care and life insurance programs to substantially all full-time employees. Amounts expensed for these programs totaled $4.0 million, $3.5 million and $3.6 million in 2017, 2016 and 2015 respectively. These insurance programs are also available to retired employees at their own expense.
NOTE 15 – OTHER NON-INTEREST INCOME
Other non-interest income for the years ended December 31 follows:
|
|
2017
|
2016
|
2015
|
||||||
|
|
(In thousands)
|
||||||||
|
Investment and insurance commissions
|
$
|
1,968
|
|
$
|
1,647
|
|
$
|
1,827
|
|
|
ATM fees
|
|
1,446
|
|
|
1,496
|
|
|
1,551
|
|
|
Bank owned life insurance
|
|
1,061
|
|
|
1,124
|
|
|
1,282
|
|
|
Other
|
|
3,693
|
|
|
4,336
|
|
|
4,188
|
|
|
Total other non-interest income
|
$
|
8,168
|
|
$
|
8,603
|
|
$
|
8,848
|
|
79
NOTES TO CONSOLIDATED FINANCIAL STATEMENTS — (Continued)
NOTE 16 – DERIVATIVE FINANCIAL INSTRUMENTS
We are required to record derivatives on our Consolidated Statements of Financial Condition as assets and liabilities measured at their fair value. The accounting for increases and decreases in the value of derivatives depends upon the use of derivatives and whether the derivatives qualify for hedge accounting.
Our derivative financial instruments according to the type of hedge in which they are designated at December 31 follow:
|
|
2017
|
||||||||
|
|
Notional
Amount |
Average
Maturity (years) |
Fair
Value |
||||||
|
|
(Dollars in thousands)
|
||||||||
|
Cash flow hedge designation
|
|
|
|
|
|
|
|
|
|
|
Pay-fixed interest rate swap agreements
|
$
|
15,000
|
|
|
3.7
|
|
$
|
245
|
|
|
Interest rate cap agreements
|
|
45,000
|
|
|
3.5
|
|
|
976
|
|
|
Total
|
$
|
60,000
|
|
|
3.6
|
|
$
|
1,221
|
|
|
|
|
|
|
|
|
|
|
|
|
|
No hedge designation
|
|
|
|
|
|
|
|
|
|
|
Rate-lock mortgage loan commitments
|
$
|
25,032
|
|
|
0.1
|
|
$
|
530
|
|
|
Mandatory commitments to sell mortgage loans
|
|
56,127
|
|
|
0.1
|
|
|
37
|
|
|
Pay-fixed interest rate swap agreements
|
|
75,990
|
|
|
6.2
|
|
|
292
|
|
|
Pay-variable interest rate swap agreements
|
|
75,990
|
|
|
6.2
|
|
|
(292
|
)
|
|
Purchased options
|
|
3,119
|
|
|
3.5
|
|
|
322
|
|
|
Written options
|
|
3,119
|
|
|
3.5
|
|
|
(322
|
)
|
|
Total
|
$
|
239,377
|
|
|
4.1
|
|
$
|
567
|
|
|
|
2016
|
||||||||
|
|
Notional
Amount |
Average
Maturity (years) |
Fair
Value |
||||||
|
|
(Dollars in thousands)
|
||||||||
|
No hedge designation
|
|
|
|
|
|
|
|
|
|
|
Rate-lock mortgage loan commitments
|
$
|
26,658
|
|
|
0.1
|
|
$
|
646
|
|
|
Mandatory commitments to sell mortgage loans
|
|
61,954
|
|
|
0.1
|
|
|
630
|
|
|
Pay-fixed interest rate swap agreements
|
|
46,121
|
|
|
8.6
|
|
|
249
|
|
|
Pay-variable interest rate swap agreements
|
|
46,121
|
|
|
8.6
|
|
|
(249
|
)
|
|
Purchased options
|
|
3,119
|
|
|
4.5
|
|
|
238
|
|
|
Written options
|
|
3,119
|
|
|
4.5
|
|
|
(238
|
)
|
|
Total
|
$
|
187,092
|
|
|
4.4
|
|
$
|
1,276
|
|
We have established management objectives and strategies that include interest-rate risk parameters for maximum fluctuations in net interest income and market value of portfolio equity. We monitor our interest rate risk position via simulation modeling reports. The goal of our asset/liability management efforts is to maintain profitable financial leverage within established risk parameters.
To meet our asset/liability management objectives, we may periodically enter into derivative financial instruments to mitigate exposure to fluctuations in cash flows resulting from changes in interest rates (“Cash Flow Hedges”). Cash Flow Hedges included certain pay-fixed interest rate swaps and interest rate cap agreements. Pay-fixed interest rate swaps convert the variable-rate cash flows on debt obligations to fixed-rates. Under interest-rate cap agreements, we will receive cash if interest rates rise above a predetermined level. As a result, we
80
NOTES TO CONSOLIDATED FINANCIAL STATEMENTS — (Continued)
effectively have variable-rate debt with an established maximum rate. We pay an upfront premium on interest rate caps which is recognized in earnings in the same period in which the hedged item affects earnings. Unrecognized premiums from interest rate caps aggregated to $0.9 million at December 31, 2017.
It is anticipated that $0.10 million, net of tax, of unrealized gains on Cash Flow Hedges at December 31, 2017, will be reclassified into earnings over the next twelve months. The maximum term of any Cash Flow Hedge at December 31, 2017 is 3.9 years.
Certain derivative financial instruments have not been designated as hedges. The fair value of these derivative financial instruments has been recorded on our Consolidated Statements of Financial Condition and is adjusted on an ongoing basis to reflect their then current fair value. The changes in fair value of derivative financial instruments not designated as hedges are recognized in earnings.
In the ordinary course of business, we enter into rate-lock mortgage loan commitments with customers (“Rate-Lock Commitments”). These commitments expose us to interest rate risk. We also enter into mandatory commitments to sell mortgage loans (“Mandatory Commitments”) to reduce the impact of price fluctuations of mortgage loans held for sale and Rate-Lock Commitments. Mandatory Commitments help protect our loan sale profit margin from fluctuations in interest rates. The changes in the fair value of Rate Lock Commitments and Mandatory Commitments are recognized currently as part of net gains on mortgage loans in the Consolidated Statements of Operations. We obtain market prices on Mandatory Commitments and Rate-Lock Commitments. Net gains on mortgage loans, as well as net income, may be more volatile as a result of these derivative instruments, which are not designated as hedges.
We currently offer to our deposit customers an equity linked time deposit product (“Altitude CD”). The Altitude CD is a time deposit that provides the customer a guaranteed return of principal at maturity plus a potential equity return (a written option), while we receive a like stream of funds based on the equity return (a purchased option). The written and purchased options will generally move in opposite directions resulting in little or no net impact on our Consolidated Statements of Operations. All of the written and purchased options in the table above relate to this Altitude CD product.
We have a program that allows commercial loan customers to lock in a fixed rate for a longer period of time than we would normally offer for interest rate risk reasons. We will enter into a variable rate commercial loan and an interest rate swap agreement with a customer and then enter into an offsetting interest rate swap agreement with an unrelated party. The interest rate swap agreement fair values will generally move in opposite directions resulting in little or no net impact on our Consolidated Statements of Operations. All of the interest rate swap agreements with no hedge designation in the table above relate to this program.
81
NOTES TO CONSOLIDATED FINANCIAL STATEMENTS — (Continued)
The following tables illustrate the impact that the derivative financial instruments discussed above have on individual line items in the Consolidated Statements of Financial Condition for the periods presented:
Fair Values of Derivative Instruments
|
|
Asset Derivatives
|
Liability Derivatives
|
||||||||||||||||||||||
|
|
December 31,
|
December 31,
|
||||||||||||||||||||||
|
|
2017
|
2016
|
2017
|
2016
|
||||||||||||||||||||
|
|
Balance
Sheet Location |
Fair
Value |
Balance
Sheet Location |
Fair
Value |
Balance
Sheet Location |
Fair
Value |
Balance
Sheet Location |
Fair
Value |
||||||||||||||||
|
|
(In thousands)
|
|||||||||||||||||||||||
|
Derivatives designated
as hedging instruments |
|
|
|
|
|
|
|
|
|
|
|
|
|
|
|
|
|
|
|
|
|
|
|
|
|
Pay-fixed interest rate
swap agreements |
Other assets
|
$
|
245
|
|
Other assets
|
$
|
—
|
|
Other liabilities
|
$
|
—
|
|
Other liabilities
|
$
|
—
|
|
||||||||
|
Interest rate cap
agreements |
Other assets
|
|
976
|
|
Other assets
|
|
—
|
|
Other liabilities
|
|
—
|
|
Other liabilities
|
|
—
|
|
||||||||
|
|
|
|
1,221
|
|
|
|
—
|
|
|
|
—
|
|
|
|
—
|
|
||||||||
|
Derivatives not designated
as hedging instruments |
|
|
|
|
|
|
|
|
|
|
|
|
|
|
|
|
||||||||
|
Rate-lock mortgage
loan commitments |
Other assets
|
|
530
|
|
Other assets
|
|
646
|
|
Other liabilities
|
|
—
|
|
Other liabilities
|
|
—
|
|
||||||||
|
Mandatory commitments
to sell mortgage loans |
Other assets
|
|
37
|
|
Other assets
|
|
630
|
|
Other liabilities
|
|
—
|
|
Other liabilities
|
|
—
|
|
||||||||
|
Pay-fixed interest rate
swap agreements |
Other assets
|
|
631
|
|
Other assets
|
|
493
|
|
Other liabilities
|
|
339
|
|
Other liabilities
|
|
244
|
|
||||||||
|
Pay-variable interest rate swap agreements
|
Other assets
|
|
339
|
|
Other assets
|
|
244
|
|
Other liabilities
|
|
631
|
|
Other liabilities
|
|
493
|
|
||||||||
|
Purchased options
|
Other assets
|
|
322
|
|
Other assets
|
|
238
|
|
Other liabilities
|
|
—
|
|
Other liabilities
|
|
—
|
|
||||||||
|
Written options
|
Other assets
|
|
—
|
|
Other assets
|
|
—
|
|
Other liabilities
|
|
322
|
|
Other liabilities
|
|
238
|
|
||||||||
|
|
|
|
1,859
|
|
|
|
2,251
|
|
|
|
1,292
|
|
|
|
975
|
|
||||||||
|
Total derivatives
|
|
$
|
3,080
|
|
|
$
|
2,251
|
|
|
$
|
1,292
|
|
|
$
|
975
|
|
||||||||
The effect of derivative financial instruments on the Consolidated Statements of Operations follows:
|
|
Year Ended December 31,
|
||||||||||||||||||||||||||||||||
|
|
Gain Recognized in Other Comprehensive Income (Loss) (Effective Portion) |
Location
of Loss Reclassified from Accumulated Other Comprehensive Loss into Income (Effective Portion) |
Loss Reclassified from
Accumulated Other Comprehensive Loss into Income (Effective Portion) |
Location of
Gain (Loss) Recognized in Income (1) |
Gain (Loss)
Recognized in Income (1) |
||||||||||||||||||||||||||||
|
|
2017
|
2016
|
2015
|
2017
|
2016
|
2015
|
2017
|
2016
|
2015
|
||||||||||||||||||||||||
|
|
(In thousands)
|
||||||||||||||||||||||||||||||||
|
Cash Flow Hedges
|
|
|
|
|
|
|
|
|
|
|
|
|
|
|
|
|
|
|
|
|
|
|
|
|
|
|
|
|
|
|
|
|
|
|
Interest rate cap agreements
|
$
|
108
|
|
$
|
—
|
|
$
|
—
|
|
|
|
|
$
|
—
|
|
$
|
—
|
|
$
|
—
|
|
|
|
|
$
|
—
|
|
$
|
—
|
|
$
|
—
|
|
|
Pay-fixed interest rate swap agreements
|
|
216
|
|
|
—
|
|
|
—
|
|
Interest
expense |
|
(18
|
)
|
|
—
|
|
|
—
|
|
Interest
expense |
|
(12
|
)
|
|
—
|
|
|
—
|
|
||||
|
Total
|
$
|
324
|
|
$
|
—
|
|
$
|
—
|
|
|
$
|
(18
|
)
|
$
|
—
|
|
$
|
—
|
|
|
$
|
(12
|
)
|
$
|
—
|
|
$
|
—
|
|
||||
|
No hedge designation
|
|
|
|
|
|
|
|
|
|
|
|
|
|
|
|
|
|
|
|
|
|
|
|
|
|
|
|
|
|
||||
|
Rate-lock mortgage loan commitments
|
Net gains on
mortgage loans |
$
|
(116
|
)
|
$
|
96
|
|
$
|
113
|
|
|||||||||||||||||||||||
|
Mandatory commitments to sell mortgage loans
|
Net gains on
mortgage loans |
|
(593
|
)
|
|
561
|
|
|
253
|
|
|||||||||||||||||||||||
|
Pay-fixed interest rate swap agreements
|
Interest
income |
|
43
|
|
|
746
|
|
|
(315
|
)
|
|||||||||||||||||||||||
|
Pay-variable interest rate swap agreements
|
Interest
income |
|
(43
|
)
|
|
(746
|
)
|
|
315
|
|
|||||||||||||||||||||||
|
Purchased options
|
Interest
expense |
|
84
|
|
|
116
|
|
|
122
|
|
|||||||||||||||||||||||
|
Written options
|
Interest
expense |
|
(84
|
)
|
|
(116
|
)
|
|
(122
|
)
|
|||||||||||||||||||||||
|
Total
|
|
$
|
(709
|
)
|
$
|
657
|
|
$
|
366
|
|
|||||||||||||||||||||||
| (1) | For cash flow hedges, this location and amount refers to the ineffective portion. |
82
NOTES TO CONSOLIDATED FINANCIAL STATEMENTS — (Continued)
NOTE 17 – RELATED PARTY TRANSACTIONS
Certain of our directors and executive officers, including companies in which they are officers or have significant ownership, were loan and deposit customers during 2017 and 2016.
A summary of loans to our directors and executive officers whose borrowing relationship (which includes loans to entities in which the individual owns a 10% or more voting interest) exceeds $60,000 for the years ended December 31 follows:
|
|
2017
|
2016
|
||||
|
|
(In thousands)
|
|||||
|
Balance at beginning of year
|
$
|
415
|
|
$
|
190
|
|
|
New loans and advances
|
|
2,945
|
|
|
594
|
|
|
Repayments
|
|
(791
|
)
|
|
(369
|
)
|
|
Balance at end of year
|
$
|
2,569
|
|
$
|
415
|
|
Deposits held by us for directors and executive officers totaled $1.4 million and $1.0 million at December 31, 2017 and 2016, respectively.
NOTE 18 – LEASES
We have non-cancelable operating leases for certain office facilities, some of which include renewal options and escalation clauses.
A summary of future minimum lease payments under non-cancelable operating leases at December 31, 2017, follows:
|
|
(In thousands)
|
||
|
2018
|
$
|
1,310
|
|
|
2019
|
|
974
|
|
|
2020
|
|
849
|
|
|
2021
|
|
460
|
|
|
2022
|
|
112
|
|
|
2023 and thereafter
|
|
387
|
|
|
Total
|
$
|
4,092
|
|
Rental expense on operating leases totaled $1.4 million, $1.2 million and $1.2 million in 2017, 2016 and 2015, respectively.
NOTE 19 – CONCENTRATIONS OF CREDIT RISK
Credit risk is the risk to earnings and capital arising from an obligor’s failure to meet the terms of any contract with our organization or otherwise fail to perform as agreed. Credit risk can occur outside of our traditional lending activities and can exist in any activity where success depends on counterparty, issuer or borrower performance. Concentrations of credit risk (whether on- or off-balance sheet) arising from financial instruments can exist in relation to individual borrowers or groups of borrowers, certain types of collateral, certain types of industries or certain geographic regions. Credit risk associated with these concentrations could arise when a significant amount of loans or other financial instruments, related by similar characteristics, are simultaneously impacted by changes in economic or other conditions that cause their probability of repayment or other type of settlement to be adversely affected. Our major concentrations of credit risk arise by collateral type and by industry. The significant concentrations by collateral type at December 31, 2017, include $809.2 million of loans secured by residential real estate and $143.2 million of construction and development loans.
83
NOTES TO CONSOLIDATED FINANCIAL STATEMENTS — (Continued)
Additionally, within our commercial real estate and commercial loan portfolio, we had significant standard industry classification concentrations in the following categories as of December 31, 2017: Lessors of Nonresidential Real Estate ($263.5 million); Lessors of Residential Real Estate ($99.6 million); Construction ($71.4 million) and Manufacturing ($62.9 million). A geographic concentration arises because we primarily conduct our lending activities in the State of Michigan.
NOTE 20 – REGULATORY MATTERS
Capital guidelines adopted by federal and state regulatory agencies and restrictions imposed by law limit the amount of cash dividends our Bank can pay to us. Under these guidelines, the amount of dividends that may be paid in any calendar year is limited to the Bank’s current year net profits, combined with the retained net profits of the preceding two years. Further, the Bank cannot pay a dividend at any time that it has negative undivided profits. As of December 31, 2017, the Bank had positive undivided profits of $17.4 million. It is not our intent to have dividends paid in amounts that would reduce the capital of our Bank to levels below those which we consider prudent and in accordance with guidelines of regulatory authorities.
We are also subject to various regulatory capital requirements. The prompt corrective action regulations establish quantitative measures to ensure capital adequacy and require minimum amounts and ratios of total, Tier 1, and common equity Tier 1 capital to risk-weighted assets and Tier 1 capital to average assets. Failure to meet minimum capital requirements can result in certain mandatory, and possibly discretionary, actions by regulators that could have a material effect on our consolidated financial statements. Under capital adequacy guidelines, we must meet specific capital requirements that involve quantitative measures as well as qualitative judgments by the regulators. The most recent regulatory filings as of December 31, 2017 and 2016, categorized our Bank as well capitalized. Management is not aware of any conditions or events that would have changed the most recent Federal Deposit Insurance Corporation (“FDIC”) categorization.
On July 2, 2013, the Federal Reserve approved a final rule that establishes an integrated regulatory capital framework (the “New Capital Rules”). The rule implements in the United States the Basel III regulatory capital reforms from the Basel Committee on Banking Supervision and certain changes required by the Dodd-Frank Act. In general, under the New Capital Rules, minimum requirements have increased for both the quantity and quality of capital held by banking organizations. Consistent with the international Basel framework, the New Capital Rules include a new minimum ratio of common equity Tier 1 capital to risk-weighted assets of 4.5% and a common equity Tier 1 capital conservation buffer of 2.5% of risk-weighted assets that applies to all supervised financial institutions. The capital conservation buffer began to phase in on January 1, 2016 with 1.25% and 0.625% added to the minimum ratio for adequately capitalized institutions for 2017 and 2016, respectively and 0.625% will be added each subsequent year until fully phased in during 2019. This capital conservation buffer is not reflected in the table that follows. To avoid limits on capital distributions and certain discretionary bonus payments we must meet the minimum ratio for adequately capitalized institutions plus the phased in buffer. The rule also raises the minimum ratio of Tier 1 capital to risk-weighted assets from 4% to 6% and includes a minimum leverage ratio of 4% for all banking organizations. As to the quality of capital, the New Capital Rules emphasize common equity Tier 1 capital, the most loss-absorbing form of capital, and implement strict eligibility criteria for regulatory capital instruments. The New Capital Rules also change the methodology for calculating risk-weighted assets to enhance risk sensitivity.
84
NOTES TO CONSOLIDATED FINANCIAL STATEMENTS — (Continued)
Our actual capital amounts and ratios at December 31 follow:
|
|
Actual
|
Minimum for
Adequately Capitalized Institutions |
Minimum for
Well-Capitalized Institutions |
|||||||||||||||
|
|
Amount
|
Ratio
|
Amount
|
Ratio
|
Amount
|
Ratio
|
||||||||||||
|
|
(Dollars in thousands)
|
|||||||||||||||||
|
2017
|
|
|
|
|
|
|
|
|
|
|
|
|
|
|
|
|
|
|
|
Total capital to risk-weighted assets
|
|
|
|
|
|
|
|
|
|
|
|
|
|
|
|
|
|
|
|
Consolidated
|
$
|
312,163
|
|
|
15.16
|
%
|
$
|
164,782
|
|
|
8.00
|
%
|
NA
|
|
NA
|
|
||
|
Independent Bank
|
|
290,188
|
|
|
14.10
|
|
|
164,675
|
|
|
8.00
|
|
$205,843
|
|
10.00
|
%
|
||
|
|
|
|
|
|
|
|
|
|
|
|
|
|
|
|
|
|
||
|
Tier 1 capital to risk-weighted assets
|
|
|
|
|
|
|
|
|
|
|
|
|
|
|
|
|
||
|
Consolidated
|
$
|
288,451
|
|
|
14.00
|
%
|
$
|
123,586
|
|
|
6.00
|
%
|
NA
|
|
NA
|
|
||
|
Independent Bank
|
|
266,476
|
|
|
12.95
|
|
|
123,506
|
|
|
6.00
|
|
$164,675
|
|
8.00
|
%
|
||
|
|
|
|
|
|
|
|
|
|
|
|
|
|
|
|
|
|
||
|
Common equity tier 1 capital to
risk-weighted assets |
|
|
|
|
|
|
|
|
|
|
|
|
|
|
|
|
||
|
Consolidated
|
$
|
255,934
|
|
|
12.43
|
%
|
$
|
92,690
|
|
|
4.50
|
%
|
NA
|
|
NA
|
|
||
|
Independent Bank
|
|
266,476
|
|
|
12.95
|
|
|
92,630
|
|
|
4.50
|
|
$133,798
|
|
6.50
|
%
|
||
|
|
|
|
|
|
|
|
|
|
|
|
|
|
|
|
|
|
||
|
Tier 1 capital to average assets
|
|
|
|
|
|
|
|
|
|
|
|
|
|
|
|
|
||
|
Consolidated
|
$
|
288,451
|
|
|
10.57
|
%
|
$
|
109,209
|
|
|
4.00
|
%
|
NA
|
|
NA
|
|
||
|
Independent Bank
|
|
266,476
|
|
|
9.78
|
|
|
109,041
|
|
|
4.00
|
|
$136,301
|
|
5.00
|
%
|
||
|
|
|
|
|
|
|
|
|
|
|
|
|
|
|
|
|
|
||
|
2016
|
|
|
|
|
|
|
|
|
|
|
|
|
|
|
|
|
||
|
Total capital to risk-weighted assets
|
|
|
|
|
|
|
|
|
|
|
|
|
|
|
|
|
||
|
Consolidated
|
$
|
286,289
|
|
|
15.86
|
%
|
$
|
144,413
|
|
|
8.00
|
%
|
NA
|
|
NA
|
|
||
|
Independent Bank
|
|
270,855
|
|
|
15.02
|
|
|
144,223
|
|
|
8.00
|
|
$180,279
|
|
10.00
|
%
|
||
|
|
|
|
|
|
|
|
|
|
|
|
|
|
|
|
|
|
||
|
Tier 1 capital to risk-weighted assets
|
|
|
|
|
|
|
|
|
|
|
|
|
|
|
|
|
||
|
Consolidated
|
$
|
265,405
|
|
|
14.70
|
%
|
$
|
108,309
|
|
|
6.00
|
%
|
NA
|
|
NA
|
|
||
|
Independent Bank
|
|
249,971
|
|
|
13.87
|
|
|
108,167
|
|
|
6.00
|
|
$144,223
|
|
8.00
|
%
|
||
|
|
|
|
|
|
|
|
|
|
|
|
|
|
|
|
|
|
||
|
Common equity tier 1 capital to
risk-weighted assets |
|
|
|
|
|
|
|
|
|
|
|
|
|
|
|
|
||
|
Consolidated
|
$
|
238,996
|
|
|
13.24
|
%
|
$
|
81,232
|
|
|
4.50
|
%
|
NA
|
|
NA
|
|
||
|
Independent Bank
|
|
249,971
|
|
|
13.87
|
|
|
81,126
|
|
|
4.50
|
|
$117,181
|
|
6.50
|
%
|
||
|
|
|
|
|
|
|
|
|
|
|
|
|
|
|
|
|
|
||
|
Tier 1 capital to average assets
|
|
|
|
|
|
|
|
|
|
|
|
|
|
|
|
|
||
|
Consolidated
|
$
|
265,405
|
|
|
10.50
|
%
|
$
|
101,112
|
|
|
4.00
|
%
|
NA
|
|
NA
|
|
||
|
Independent Bank
|
|
249,971
|
|
|
9.90
|
|
|
101,019
|
|
|
4.00
|
|
$126,274
|
|
5.00
|
%
|
||
NA - Not applicable
85
NOTES TO CONSOLIDATED FINANCIAL STATEMENTS — (Continued)
The components of our regulatory capital are as follows:
|
|
Consolidated
|
Independent Bank
|
||||||||||
|
|
December 31,
|
December 31,
|
||||||||||
|
|
2017
|
2016
|
2017
|
2016
|
||||||||
|
|
(In thousands)
|
|||||||||||
|
Total shareholders' equity
|
$
|
264,933
|
|
$
|
248,980
|
|
$
|
269,481
|
|
$
|
258,814
|
|
|
Add (deduct)
|
|
|
|
|
|
|
|
|
|
|
|
|
|
Accumulated other comprehensive loss for regulatory purposes
|
|
201
|
|
|
3,310
|
|
|
201
|
|
|
3,310
|
|
|
Intangible assets
|
|
(1,269
|
)
|
|
(1,159
|
)
|
|
(1,269
|
)
|
|
(1,159
|
)
|
|
Disallowed deferred tax assets
|
|
(7,931
|
)
|
|
(12,135
|
)
|
|
(1,937
|
)
|
|
(10,994
|
)
|
|
Common equity tier 1 capital
|
|
255,934
|
|
|
238,996
|
|
|
266,476
|
|
|
249,971
|
|
|
Qualifying trust preferred securities
|
|
34,500
|
|
|
34,500
|
|
|
—
|
|
|
—
|
|
|
Disallowed deferred tax assets
|
|
(1,983
|
)
|
|
(8,091
|
)
|
|
—
|
|
|
—
|
|
|
Tier 1 capital
|
|
288,451
|
|
|
265,405
|
|
|
266,476
|
|
|
249,971
|
|
|
Allowance for loan losses and allowance for unfunded lending commitments limited to 1.25% of total risk-weighted assets
|
|
23,712
|
|
|
20,884
|
|
|
23,712
|
|
|
20,884
|
|
|
Total risk-based capital
|
$
|
312,163
|
|
$
|
286,289
|
|
$
|
290,188
|
|
$
|
270,855
|
|
NOTE 21 – FAIR VALUE DISCLOSURES
FASB ASC topic 820 defines fair value as the exchange price that would be received for an asset or paid to transfer a liability (an exit price) in the principal or most advantageous market for the asset or liability in an orderly transaction between market participants on the measurement date. FASB ASC topic 820 also establishes a fair value hierarchy which requires an entity to maximize the use of observable inputs and minimize the use of unobservable inputs when measuring fair value.
The standard describes three levels of inputs that may be used to measure fair value:
Level 1: Valuation is based upon quoted prices for identical instruments traded in active markets. Level 1 instruments include securities traded on active exchange markets, such as the New York Stock Exchange, as well as U.S. Treasury securities that are traded by dealers or brokers in active over-the-counter markets.
Level 2: Valuation is based upon quoted prices for similar instruments in active markets, quoted prices for identical or similar instruments in markets that are not active, and model-based valuation techniques for which all significant assumptions are observable in the market. Level 2 instruments include securities traded in less active dealer or broker markets.
Level 3: Valuation is generated from model-based techniques that use at least one significant assumption not observable in the market. These unobservable assumptions reflect estimates of assumptions that market participants would use in pricing the asset or liability. Valuation techniques include use of option pricing models, discounted cash flow models and similar techniques.
We used the following methods and significant assumptions to estimate fair value:
Securities: Where quoted market prices are available in an active market, securities (trading or available for sale) are classified as Level 1 of the valuation hierarchy. Level 1 securities include certain preferred stocks included in our trading portfolio for which there are quoted prices in active markets. If quoted market prices are not available for the specific security, then fair values are estimated by (1) using quoted market prices of securities with similar characteristics, (2) matrix pricing, which is a mathematical technique used widely in the industry to value debt securities without relying exclusively on quoted prices for specific securities but rather by relying on the securities’ relationship to other benchmark quoted prices, or (3) a discounted cash flow analysis whose significant fair value
86
NOTES TO CONSOLIDATED FINANCIAL STATEMENTS — (Continued)
inputs can generally be verified and do not typically involve judgment by management. These securities are classified as Level 2 of the valuation hierarchy and primarily include agency securities, private label mortgage-backed securities, other asset backed securities, obligations of states and political subdivisions, trust preferred securities, corporate securities and foreign government securities.
Loans held for sale: The fair value of mortgage loans held for sale is based on agency cash window loan pricing for comparable assets (recurring Level 2).
Impaired loans with specific loss allocations based on collateral value: From time to time, certain loans are considered impaired and an AFLL is established. Loans for which it is probable that payment of interest and principal will not be made in accordance with the contractual terms of the loan agreement are considered impaired. We measure our investment in an impaired loan based on one of three methods: the loan’s observable market price, the fair value of the collateral or the present value of expected future cash flows discounted at the loan’s effective interest rate. Those impaired loans not requiring an allowance represent loans for which the fair value of the expected repayments or collateral exceed the recorded investments in such loans. At December 31, 2017 and 2016, all of our total impaired loans were evaluated based on either the fair value of the collateral or the present value of expected future cash flows discounted at the loan’s effective interest rate. When the fair value of the collateral is based on an appraised value or when an appraised value is not available we record the impaired loan as nonrecurring Level 3. These appraisals may utilize a single valuation approach or a combination of approaches including comparable sales and the income approach. Adjustments are routinely made in the appraisal process by the independent appraisers to adjust for differences between the comparable sales and income data available. Such adjustments can be significant and thus will typically result in a Level 3 classification of the inputs for determining fair value.
Other real estate: At the time of acquisition, other real estate is recorded at fair value, less estimated costs to sell, which becomes the property’s new basis. Subsequent write-downs to reflect declines in value since the time of acquisition may occur from time to time and are recorded in net (gains) losses on other real estate and repossessed assets in the Consolidated Statements of Operations. The fair value of the property used at and subsequent to the time of acquisition is typically determined by a third party appraisal of the property. These appraisals may utilize a single valuation approach or a combination of approaches including comparable sales and the income approach. Adjustments are routinely made in the appraisal process by the independent appraisers to adjust for differences between the comparable sales and income data available. Such adjustments can be significant and typically result in a Level 3 classification of the inputs for determining fair value.
Appraisals for both collateral-dependent impaired loans and other real estate are performed by certified general appraisers (for commercial properties) or certified residential appraisers (for residential properties) whose qualifications and licenses have been reviewed and verified by us. Once received, an independent third party, or a member of our Collateral Evaluation Department (for commercial properties), or a member of our Special Assets/ORE Group (for residential properties) reviews the assumptions and approaches utilized in the appraisal as well as the overall resulting fair value in comparison with independent data sources such as recent market data or industry-wide statistics. We compare the actual selling price of collateral that has been sold to the most recent appraised value of our properties to determine what additional adjustment, if any, should be made to the appraisal value to arrive at fair value. For commercial and residential properties we typically discount an appraisal to account for various factors that the appraisal excludes in its assumptions. These additional discounts generally do not result in material adjustments to the appraised value.
Capitalized mortgage loan servicing rights: The fair value of capitalized mortgage loan servicing rights is based on a valuation model used by an independent third party that calculates the present value of estimated net servicing income. The valuation model incorporates assumptions that market participants would use in estimating future net servicing income. Certain model assumptions are generally unobservable and are based upon the best information available including data relating to our own servicing portfolio, reviews of mortgage servicing assumption and valuation surveys and input from various mortgage servicers and, therefore, are recorded as nonrecurring Level 3. Management evaluates the third party valuation for reasonableness each quarter as part of our financial reporting control processes. Prior to January 1, 2017, capitalized mortgage loan servicing rights were accounted for using the amortization method of accounting and were measured at fair value on a non-recurring basis. During the first quarter of 2017, we adopted the fair value method of accounting for our capitalized mortgage loan servicing rights (see note #1) and are now measured at fair value on a recurring basis.
87
NOTES TO CONSOLIDATED FINANCIAL STATEMENTS — (Continued)
Derivatives: The fair value of rate-lock mortgage loan commitments is based on agency cash window loan pricing for comparable assets and the fair value of mandatory commitments to sell mortgage loans is based on mortgage backed security pricing for comparable assets (recurring Level 2). The fair value of interest rate swap and interest rate cap agreements are derived from proprietary models which utilize current market data. The significant fair value inputs can generally be observed in the market place and do not typically involve judgment by management (recurring Level 2). The fair value of purchased and written options is based on prices of financial instruments with similar characteristics and do not typically involve judgment by management (recurring Level 2).
Assets and liabilities measured at fair value, including financial assets for which we have elected the fair value option, were as follows:
|
|
|
Fair Value Measurements Using
|
||||||||||
|
|
Fair Value
Measure- ments |
Quoted Prices
in Active Markets for Identical Assets (Level 1) |
Significant
Other Observable Inputs (Level 2) |
Significant
Un- observable Inputs (Level 3) |
||||||||
|
|
(In thousands)
|
|||||||||||
|
December 31, 2017:
|
|
|
|
|
|
|
|
|
|
|
|
|
|
Measured at Fair Value on a Recurring Basis:
|
|
|
|
|
|
|
|
|
|
|
|
|
|
Assets
|
|
|
|
|
|
|
|
|
|
|
|
|
|
Trading securities
|
$
|
455
|
|
$
|
455
|
|
$
|
—
|
|
$
|
—
|
|
|
Securities available for sale
|
|
|
|
|
|
|
|
|
|
|
|
|
|
U.S. treasury
|
|
898
|
|
|
898
|
|
|
—
|
|
|
—
|
|
|
U.S. agency
|
|
25,682
|
|
|
—
|
|
|
25,682
|
|
|
—
|
|
|
U.S. agency residential mortgage-backed
|
|
137,918
|
|
|
—
|
|
|
137,918
|
|
|
—
|
|
|
U.S. agency commercial mortgage-backed
|
|
9,760
|
|
|
—
|
|
|
9,760
|
|
|
—
|
|
|
Private label mortgage-backed
|
|
29,109
|
|
|
—
|
|
|
29,109
|
|
|
—
|
|
|
Other asset backed
|
|
93,898
|
|
|
—
|
|
|
93,898
|
|
|
—
|
|
|
Obligations of states and political subdivisions
|
|
172,945
|
|
|
—
|
|
|
172,945
|
|
|
—
|
|
|
Corporate
|
|
47,853
|
|
|
—
|
|
|
47,853
|
|
|
—
|
|
|
Trust preferred
|
|
2,802
|
|
|
—
|
|
|
2,802
|
|
|
—
|
|
|
Foreign government
|
|
2,060
|
|
|
—
|
|
|
2,060
|
|
|
—
|
|
|
Loans held for sale
|
|
39,436
|
|
|
—
|
|
|
39,436
|
|
|
—
|
|
|
Capitalized mortgage loan servicing rights
|
|
15,699
|
|
|
—
|
|
|
—
|
|
|
15,699
|
|
|
Derivatives (1)
|
|
3,080
|
|
|
—
|
|
|
3,080
|
|
|
—
|
|
|
Liabilities
|
|
|
|
|
|
|
|
|
|
|
|
|
|
Derivatives (2)
|
|
1,292
|
|
|
—
|
|
|
1,292
|
|
|
—
|
|
|
|
|
|
|
|
|
|
|
|
|
|
|
|
|
Measured at Fair Value on a Non-recurring basis:
|
|
|
|
|
|
|
|
|
|
|
|
|
|
Assets
|
|
|
|
|
|
|
|
|
|
|
|
|
|
Impaired loans (3)
|
|
|
|
|
|
|
|
|
|
|
|
|
|
Commercial
|
|
|
|
|
|
|
|
|
|
|
|
|
|
Income producing - real estate
|
|
274
|
|
|
—
|
|
|
—
|
|
|
274
|
|
|
Land, land development & construction-real estate
|
|
9
|
|
|
—
|
|
|
—
|
|
|
9
|
|
|
Commercial and industrial
|
|
1,051
|
|
|
—
|
|
|
—
|
|
|
1,051
|
|
|
Mortgage
|
|
|
|
|
|
|
|
|
|
|
|
|
|
1-4 family
|
|
339
|
|
|
—
|
|
|
—
|
|
|
339
|
|
|
Resort lending
|
|
207
|
|
|
—
|
|
|
—
|
|
|
207
|
|
|
Other real estate (4)
|
|
|
|
|
|
|
|
|
|
|
|
|
|
Mortgage
|
|
|
|
|
|
|
|
|
|
|
|
|
|
1-4 family
|
|
186
|
|
|
—
|
|
|
—
|
|
|
186
|
|
|
Resort lending
|
|
65
|
|
|
—
|
|
|
—
|
|
|
65
|
|
| (1) | Included in accrued income and other assets. |
| (2) | Included in accrued expenses and other liabilities. |
| (3) | Only includes impaired loans with specific loss allocations based on collateral value. |
| (4) | Only includes other real estate with subsequent write downs to fair value. |
88
NOTES TO CONSOLIDATED FINANCIAL STATEMENTS — (Continued)
|
|
|
Fair Value Measurements Using
|
||||||||||
|
|
Fair Value
Measure- ments |
Quoted Prices
in Active Markets for Identical Assets (Level 1) |
Significant
Other Observable Inputs (Level 2) |
Significant
Un- observable Inputs (Level 3) |
||||||||
|
|
(In thousands)
|
|||||||||||
|
December 31, 2016:
|
|
|
|
|
|
|
|
|
|
|
|
|
|
Measured at Fair Value on a Recurring Basis:
|
|
|
|
|
|
|
|
|
|
|
|
|
|
Assets
|
|
|
|
|
|
|
|
|
|
|
|
|
|
Trading securities
|
$
|
410
|
|
$
|
410
|
|
$
|
—
|
|
$
|
—
|
|
|
Securities available for sale
|
|
|
|
|
|
|
|
|
|
|
|
|
|
U.S. agency
|
|
28,988
|
|
|
—
|
|
|
28,988
|
|
|
—
|
|
|
U.S. agency residential mortgage-backed
|
|
156,289
|
|
|
—
|
|
|
156,289
|
|
|
—
|
|
|
U.S. agency commercial mortgage-backed
|
|
12,632
|
|
|
—
|
|
|
12,632
|
|
|
—
|
|
|
Private label mortgage-backed
|
|
34,727
|
|
|
—
|
|
|
34,727
|
|
|
—
|
|
|
Other asset backed
|
|
146,709
|
|
|
—
|
|
|
146,709
|
|
|
—
|
|
|
Obligations of states and political subdivisions
|
|
170,899
|
|
|
—
|
|
|
170,899
|
|
|
—
|
|
|
Corporate
|
|
56,180
|
|
|
—
|
|
|
56,180
|
|
|
—
|
|
|
Trust preferred
|
|
2,579
|
|
|
—
|
|
|
2,579
|
|
|
—
|
|
|
Foreign government
|
|
1,613
|
|
|
—
|
|
|
1,613
|
|
|
—
|
|
|
Loans held for sale
|
|
35,946
|
|
|
—
|
|
|
35,946
|
|
|
—
|
|
|
Derivatives (1)
|
|
2,251
|
|
|
—
|
|
|
2,251
|
|
|
—
|
|
|
Liabilities
|
|
|
|
|
|
|
|
|
|
|
|
|
|
Derivatives (2)
|
|
975
|
|
|
—
|
|
|
975
|
|
|
—
|
|
|
|
|
|
|
|
|
|
|
|
|
|
|
|
|
Measured at Fair Value on a Non-recurring basis:
|
|
|
|
|
|
|
|
|
|
|
|
|
|
Assets
|
|
|
|
|
|
|
|
|
|
|
|
|
|
Capitalized mortgage loan servicing rights (3)
|
|
8,163
|
|
|
—
|
|
|
—
|
|
|
8,163
|
|
|
Impaired loans (4)
|
|
|
|
|
|
|
|
|
|
|
|
|
|
Commercial
|
|
|
|
|
|
|
|
|
|
|
|
|
|
Income producing - real estate
|
|
255
|
|
|
—
|
|
|
—
|
|
|
255
|
|
|
Land, land development & construction-real estate
|
|
54
|
|
|
—
|
|
|
—
|
|
|
54
|
|
|
Commercial and industrial
|
|
1,342
|
|
|
—
|
|
|
—
|
|
|
1,342
|
|
|
Mortgage
|
|
|
|
|
|
|
|
|
|
|
|
|
|
1-4 family
|
|
361
|
|
|
—
|
|
|
—
|
|
|
361
|
|
|
Other real estate (5)
|
|
|
|
|
|
|
|
|
|
|
|
|
|
Commercial
|
|
|
|
|
|
|
|
|
|
|
|
|
|
Income producing - real estate (6)
|
|
2,863
|
|
|
—
|
|
|
2,863
|
|
|
—
|
|
|
Land, land development & construction-real estate
|
|
176
|
|
|
—
|
|
|
—
|
|
|
176
|
|
|
Mortgage
|
|
|
|
|
|
|
|
|
|
|
|
|
|
1-4 family
|
|
98
|
|
|
—
|
|
|
—
|
|
|
98
|
|
|
Resort lending
|
|
133
|
|
|
—
|
|
|
—
|
|
|
133
|
|
| (1) | Included in accrued income and other assets. |
| (2) | Included in accrued expenses and other liabilities. |
| (3) | Only includes servicing rights that are carried at fair value due to recognition of a valuation allowance. |
| (4) | Only includes impaired loans with specific loss allocations based on collateral value. |
| (5) | Only includes other real estate with subsequent write downs to fair value. |
| (6) | Level 2 valuation is based on a signed purchase agreement. |
There were no transfers between Level 1 and Level 2 during the years ended December 31, 2017 and 2016.
89
NOTES TO CONSOLIDATED FINANCIAL STATEMENTS — (Continued)
Changes in fair values of financial assets for which we have elected the fair value option for the years ended December 31 were as follows:
|
|
Net Gains (Losses) on Assets |
Mortgage
Loan Servicing, net |
Total
Change in Fair Values Included in Current Period Earnings |
|||||||||
|
|
Securities
|
Mortgage
Loans |
||||||||||
|
|
(In thousands)
|
|||||||||||
|
2017
|
|
|
|
|
|
|
|
|
|
|
|
|
|
Trading securities
|
$
|
45
|
|
$
|
—
|
|
$
|
—
|
|
$
|
45
|
|
|
Loans held for sale
|
|
—
|
|
|
407
|
|
|
—
|
|
|
407
|
|
|
Capitalized mortgage loan servicing rights
|
|
—
|
|
|
—
|
|
|
(2,744
|
)
|
|
(2,744
|
)
|
|
|
|
|
|
|
|
|
|
|
|
|
|
|
|
2016
|
|
|
|
|
|
|
|
|
|
|
|
|
|
Trading securities
|
$
|
262
|
|
$
|
—
|
|
$
|
—
|
|
$
|
262
|
|
|
Loans held for sale
|
|
—
|
|
|
(277
|
)
|
|
—
|
|
|
(277
|
)
|
|
|
|
|
|
|
|
|
|
|
|
|
|
|
|
2015
|
|
|
|
|
|
|
|
|
|
|
|
|
|
Trading securities
|
$
|
(55
|
)
|
$
|
—
|
|
$
|
—
|
|
$
|
(55
|
)
|
|
Loans held for sale
|
|
—
|
|
|
90
|
|
|
—
|
|
|
90
|
|
For those items measured at fair value pursuant to our election of the fair value option, interest income is recorded within the Consolidated Statements of Operations based on the contractual amount of interest income earned on these financial assets and dividend income is recorded based on cash dividends received.
The following represent impairment charges recognized during the years ended December 31, 2017, 2016 and 2015 relating to assets measured at fair value on a non-recurring basis:
| • | Capitalized mortgage loan servicing rights, whose individual strata are measured at fair value, had a carrying amount of $8.2 million, which is net of a valuation allowance of $2.3 million, at December 31, 2016. A recovery of $1.0 million and $0.5 million was included in our results of operations for the years ending December 31, 2016 and 2015, respectively. |
| • | Loans which are measured for impairment using the fair value of collateral for collateral dependent loans had a carrying amount of $2.6 million, with a valuation allowance of $0.7 million at December 31, 2017, and had a carrying amount of $4.0 million, with a valuation allowance of $2.0 million at December 31, 2016. An additional provision for loan losses relating to impaired loans of $0.5 million, $0.2 million and $1.1 million was included in our results of operations for the years ending December 31, 2017, 2016 and 2015, respectively. |
| • | Other real estate, which is measured using the fair value of the property, had a carrying amount of $0.3 million which is net of a valuation allowance of $0.1 million at December 31, 2017, and a carrying amount of $3.2 million, which is net of a valuation allowance of $0.8 million, at December 31, 2016. An additional charge relating to other real estate measured at fair value of $0.1 million, $0.6 million and $0.3 million was included in our results of operations during the years ended December 31, 2017, 2016 and 2015, respectively. |
90
NOTES TO CONSOLIDATED FINANCIAL STATEMENTS — (Continued)
A reconciliation for all assets and (liabilities) measured at fair value on a recurring basis using significant unobservable inputs (Level 3) for the years ended December 31 follows:
|
|
Capitalized Mortgage
Loan Servicing Rights |
||||||||
|
|
2017
|
2016
|
2015
|
||||||
|
|
(In thousands)
|
||||||||
|
Beginning balance
|
$
|
—
|
|
$
|
—
|
|
$
|
—
|
|
|
Change in accounting
|
|
14,213
|
|
|
—
|
|
|
—
|
|
|
Beginning balance, as adjusted
|
|
14,213
|
|
|
—
|
|
|
—
|
|
|
Total losses realized and unrealized:
|
|
|
|
|
|
|
|
|
|
|
Included in results of operations
|
|
(2,744
|
)
|
|
—
|
|
|
—
|
|
|
Included in other comprehensive income
|
|
—
|
|
|
—
|
|
|
—
|
|
|
Purchases, issuances, settlements, maturities and calls
|
|
4,230
|
|
|
—
|
|
|
—
|
|
|
Transfers in and/or out of Level 3
|
|
—
|
|
|
—
|
|
|
—
|
|
|
Ending balance
|
$
|
15,699
|
|
$
|
—
|
|
$
|
—
|
|
|
|
|
|
|
|
|
|
|
|
|
|
Amount of total losses for the period included in earnings attributable to the change in unrealized gains (losses) relating to assets and liabilities still held at December 31
|
$
|
(2,744
|
)
|
$
|
—
|
|
$
|
—
|
|
As discussed above we changed the accounting for capitalized mortgage loan servicing rights during the first quarter of 2017 (see note #1) and are now measuring valuation on a recurring basis. The fair value of our capitalized mortgage loan servicing rights has been determined based on a valuation model used by an independent third party as discussed above. The significant unobservable inputs used in the fair value measurement of the capitalized mortgage loan servicing rights are discount rate, cost to service, ancillary income and float rate. Significant changes in all four of these assumptions in isolation would result in significant changes to the value of our capitalized mortgage loan servicing rights. Quantitative information about our Level 3 fair value measurements measured on a recurring basis follows:
|
|
Asset
Fair Value |
Valuation
Technique |
Unobservable
Inputs |
Range
|
Weighted
Average |
|
|
(In thousands)
|
|
|
|
|
|
Capitalized mortgage loan
servicing rights |
$15,699 |
Present value of net servicing revenue |
Discount rate Cost to service Ancillary income Float rate |
9.88% to 11.00% $66 to $216 20 to 36 2.24% to 2.24% |
10.11% $81 23 2.24% |
91
NOTES TO CONSOLIDATED FINANCIAL STATEMENTS — (Continued)
Quantitative information about Level 3 fair value measurements measured on a non-recurring basis follows:
|
|
Asset
Fair Value |
Valuation
Technique |
Unobservable
Inputs |
Range
|
Weighted
Average |
||||||||||
|
|
(In thousands)
|
|
|
|
|
||||||||||
|
2017
|
|
|
|
|
|
|
|
|
|
|
|
|
|
|
|
|
Impaired loans
|
|
|
|
|
|
|
|
|
|
|
|
|
|
|
|
|
Commercial
|
$1,334
|
Sales comparison approach
|
Adjustment for differences between comparable sales
|
(32.5)% to 25.0%
|
|
(4.5
|
)%
|
||||||||
|
|
|
|
|
|
|
|
|
||||||||
|
Mortgage
|
546
|
Sales comparison approach
|
Adjustment for differences between comparable sales
|
(21.1) to 34.1
|
|
(2.7
|
)
|
||||||||
|
|
|
|
|
|
|
|
|
||||||||
|
Other real estate-Mortgage
|
251
|
Sales comparison approach
|
Adjustment for differences between comparable sales
|
(33.0) to 44.5
|
|
(1.0
|
)
|
||||||||
|
2016
|
|
|
|
|
|
|
|
||||||||
|
Capitalized mortgage loan
servicing rights |
$ 8,163 |
Present value of net servicing revenue |
Discount rate Cost to service Ancillary income Float rate |
10.00% to 11.00% $66 to $168 20 to 40 1.97% to 1.97% |
10.07% $ 83 24 1.97 % |
||||||||||
|
|
|
|
|
|
|
||||||||||
|
Impaired loans
|
|
|
|
|
|
||||||||||
|
Commercial (1)
|
1,446
|
Sales comparison approach
|
Adjustment for differences between comparable sales
|
(25.0)% to 17.0%
|
(1.5) %
|
||||||||||
|
|
|
|
|
|
|
||||||||||
|
Mortgage
|
361
|
Sales comparison approach
|
Adjustment for differences between comparable sales
|
(23.2) to 19.4
|
(4.7)
|
||||||||||
|
|
|
|
|
|
|
||||||||||
|
Other real estate
|
|
|
|
|
|
||||||||||
|
Commercial
|
176
|
Sales comparison approach
|
Adjustment for differences between comparable sales
|
(35.0) to 0.0
|
(22.5)
|
||||||||||
|
|
|
|
|
|
|
||||||||||
|
Mortgage and installment
|
231
|
Sales comparison approach
|
Adjustment for differences between comparable sales
|
(26.8) to 2.8
|
(5.1)
|
||||||||||
| (1) | In addition to the valuation techniques and unobservable inputs discussed above, at December 31, 2016, we had an impaired collateral dependent commercial relationship that totaled $0.2 million that was primarily secured by collateral other than real estate. Collateral securing this relationship primarily included machinery and equipment and inventory at December 31, 2016. Valuation techniques at December 31, 2016, included appraisals and discounting restructuring firm valuations based on estimates of value recovery of each particular asset type. Discount rates used ranged from 0% to 100% of stated values. |
92
NOTES TO CONSOLIDATED FINANCIAL STATEMENTS — (Continued)
The following table reflects the difference between the aggregate fair value and the aggregate remaining contractual principal balance outstanding for loans held for sale for which the fair value option has been elected at December 31.
|
|
Aggregate
Fair Value |
Difference
|
Contractual
Principal |
||||||
|
|
(In thousands)
|
||||||||
|
Loans held for sale
|
|
|
|
|
|
|
|
|
|
|
2017
|
$
|
39,436
|
|
$
|
844
|
|
$
|
38,592
|
|
|
2016
|
|
35,946
|
|
|
437
|
|
|
35,509
|
|
|
2015
|
|
27,866
|
|
|
714
|
|
|
27,152
|
|
NOTE 22 – FAIR VALUES OF FINANCIAL INSTRUMENTS
Most of our assets and liabilities are considered financial instruments. Many of these financial instruments lack an available trading market and it is our general practice and intent to hold the majority of our financial instruments to maturity. Significant estimates and assumptions were used to determine the fair value of financial instruments. These estimates are subjective in nature, involving uncertainties and matters of judgment, and therefore, fair values may not be a precise estimate. Changes in assumptions could significantly affect the estimates.
Estimated fair values have been determined using available data and methodologies that are considered suitable for each category of financial instrument. For instruments with adjustable-interest rates which reprice frequently and without significant credit risk, it is presumed that estimated fair values approximate the recorded book balances. Fair value methodologies discussed below do not necessarily represent an exit price in the determination of the fair value of these financial instruments.
Cash and due from banks and interest bearing deposits: The recorded book balance of cash and due from banks and interest bearing deposits approximate fair value and are classified as Level 1.
Interest bearing deposits - time: Interest bearing deposits - time have been valued based on a model using a benchmark yield curve plus a base spread and are classified as Level 2.
Securities: Financial instrument assets actively traded in a secondary market have been valued using quoted market prices. Trading securities and U.S. treasury securities available for sale are classified as Level 1 while all other securities available for sale are classified as Level 2 as described in note #21.
Federal Home Loan Bank and Federal Reserve Bank Stock: It is not practicable to determine the fair value of FHLB and FRB Stock due to restrictions placed on transferability.
Net loans and loans held for sale: The fair value of loans is calculated by discounting estimated future cash flows using estimated market discount rates that reflect credit and interest-rate risk inherent in the loans and do not necessarily represent an exit price. Loans are classified as Level 3. Impaired loans are valued at the lower of cost or fair value as described in note #21. Loans held for sale are classified as Level 2 as described in note #21. Payment plan receivables held for sale are also classified as Level 2 based on a signed APA as described in note #1.
Accrued interest receivable and payable: The recorded book balance of accrued interest receivable and payable approximate fair value and are classified at the same Level as the asset and liability they are associated with.
Derivative financial instruments: The fair value of rate-lock mortgage loan commitments is based on agency cash window loan pricing for comparable assets, the fair value of mandatory commitments to sell mortgage loans is based on mortgage backed security pricing for comparable assets, the fair value of interest rate swap and interest rate cap agreements is derived from proprietary models which utilize current market data whose significant fair value inputs can generally be observed in the market place and do not typically involve judgment by management and the fair value of purchased and written options is based on prices of financial instruments with similar characteristics and do not typically involve judgment by management. Each of these instruments has been classified as Level 2 as described in note #21.
93
NOTES TO CONSOLIDATED FINANCIAL STATEMENTS — (Continued)
Deposits: Deposits without a stated maturity, including demand deposits, savings, NOW and money market accounts, have a fair value equal to the amount payable on demand. Each of these instruments is classified as Level 1. Deposits with a stated maturity, such as time deposits, have generally been valued based on the discounted value of contractual cash flows using a discount rate approximating current market rates for liabilities with a similar maturity resulting in a Level 2 classification.
Other borrowings: Other borrowings have been valued based on the discounted value of contractual cash flows using a discount rate approximating current market rates for liabilities with a similar maturity resulting in a Level 2 classification.
Subordinated debentures: Subordinated debentures have generally been valued based on a quoted market price of similar instruments resulting in a Level 2 classification.
94
NOTES TO CONSOLIDATED FINANCIAL STATEMENTS — (Continued)
The estimated recorded book balances and fair values at December 31 follow:
|
|
|
|
Fair Value Using
|
||||||||||||
|
|
Recorded
Book Balance |
Fair Value
|
Quoted Prices
in Active Markets for Identical Assets (Level 1) |
Significant
Other Observable Inputs (Level 2) |
Significant
Un- observable Inputs (Level 3) |
||||||||||
|
|
(In thousands)
|
||||||||||||||
|
2017
|
|
|
|
|
|
|
|
|
|
|
|
|
|
|
|
|
Assets
|
|
|
|
|
|
|
|
|
|
|
|
|
|
|
|
|
Cash and due from banks
|
$
|
36,994
|
|
$
|
36,994
|
|
$
|
36,994
|
|
$
|
—
|
|
$
|
—
|
|
|
Interest bearing deposits
|
|
17,744
|
|
|
17,744
|
|
|
17,744
|
|
|
—
|
|
|
—
|
|
|
Interest bearing deposits - time
|
|
2,739
|
|
|
2,740
|
|
|
—
|
|
|
2,740
|
|
|
—
|
|
|
Trading securities
|
|
455
|
|
|
455
|
|
|
455
|
|
|
—
|
|
|
—
|
|
|
Securities available for sale
|
|
522,925
|
|
|
522,925
|
|
|
898
|
|
|
522,027
|
|
|
—
|
|
|
Federal Home Loan Bank and Federal Reserve Bank Stock
|
|
15,543
|
|
|
NA
|
|
|
NA
|
|
|
NA
|
|
|
NA
|
|
|
Net loans and loans held for sale
|
|
2,035,666
|
|
|
1,962,937
|
|
|
—
|
|
|
39,436
|
|
|
1,923,501
|
|
|
Accrued interest receivable
|
|
8,609
|
|
|
8,609
|
|
|
1
|
|
|
2,192
|
|
|
6,416
|
|
|
Derivative financial instruments
|
|
3,080
|
|
|
3,080
|
|
|
—
|
|
|
3,080
|
|
|
—
|
|
|
Liabilities
|
|
|
|
|
|
|
|
|
|
|
|
|
|
|
|
|
Deposits with no stated maturity (1)
|
$
|
1,845,716
|
|
$
|
1,845,716
|
|
$
|
1,845,716
|
|
$
|
—
|
|
$
|
—
|
|
|
Deposits with stated maturity (1)
|
|
554,818
|
|
|
551,489
|
|
|
—
|
|
|
551,489
|
|
|
—
|
|
|
Other borrowings
|
|
54,600
|
|
|
54,918
|
|
|
—
|
|
|
54,918
|
|
|
—
|
|
|
Subordinated debentures
|
|
35,569
|
|
|
29,946
|
|
|
—
|
|
|
29,946
|
|
|
—
|
|
|
Accrued interest payable
|
|
892
|
|
|
892
|
|
|
48
|
|
|
844
|
|
|
—
|
|
|
Derivative financial instruments
|
|
1,292
|
|
|
1,292
|
|
|
—
|
|
|
1,292
|
|
|
—
|
|
|
2016
|
|
|
|
|
|
|
|
|
|
|
|
|
|
|
|
|
Assets
|
|
|
|
|
|
|
|
|
|
|
|
|
|
|
|
|
Cash and due from banks
|
$
|
35,238
|
|
$
|
35,238
|
|
$
|
35,238
|
|
$
|
—
|
|
$
|
—
|
|
|
Interest bearing deposits
|
|
47,956
|
|
|
47,956
|
|
|
47,956
|
|
|
—
|
|
|
—
|
|
|
Interest bearing deposits - time
|
|
5,591
|
|
|
5,611
|
|
|
—
|
|
|
5,611
|
|
|
—
|
|
|
Trading securities
|
|
410
|
|
|
410
|
|
|
410
|
|
|
—
|
|
|
—
|
|
|
Securities available for sale
|
|
610,616
|
|
|
610,616
|
|
|
—
|
|
|
610,616
|
|
|
—
|
|
|
Federal Home Loan Bank and Federal Reserve Bank Stock
|
|
15,543
|
|
|
NA
|
|
|
NA
|
|
|
NA
|
|
|
NA
|
|
|
Net loans and loans held for sale (2)
|
|
1,655,335
|
|
|
1,629,587
|
|
|
—
|
|
|
67,321
|
|
|
1,562,266
|
|
|
Accrued interest receivable
|
|
7,316
|
|
|
7,316
|
|
|
5
|
|
|
2,364
|
|
|
4,947
|
|
|
Derivative financial instruments
|
|
2,251
|
|
|
2,251
|
|
|
—
|
|
|
2,251
|
|
|
—
|
|
|
Liabilities
|
|
|
|
|
|
|
|
|
|
|
|
|
|
|
|
|
Deposits with no stated maturity (1)
|
$
|
1,740,601
|
|
$
|
1,740,601
|
|
$
|
1,740,601
|
|
$
|
—
|
|
$
|
—
|
|
|
Deposits with stated maturity (1)
|
|
485,118
|
|
|
483,469
|
|
|
—
|
|
|
483,469
|
|
|
—
|
|
|
Other borrowings
|
|
9,433
|
|
|
10,371
|
|
|
—
|
|
|
10,371
|
|
|
—
|
|
|
Subordinated debentures
|
|
35,569
|
|
|
25,017
|
|
|
—
|
|
|
25,017
|
|
|
—
|
|
|
Accrued interest payable
|
|
932
|
|
|
932
|
|
|
21
|
|
|
911
|
|
|
—
|
|
|
Derivative financial instruments
|
|
975
|
|
|
975
|
|
|
—
|
|
|
975
|
|
|
—
|
|
| (1) | Deposits with no stated maturity include reciprocal deposits with a recorded book balance of $13.0 million and $7.4 million at December 31, 2017 and 2016, respectively. Deposits with a stated maturity include reciprocal deposits with a recorded book balance of $38.0 million and $31.3 million at December 31, 2017 and 2016, respectively. |
| (2) | Net loans and loans held for sale at December 31, 2016 include $31.4 million of payment plan receivables and commercial loans held for sale. |
95
NOTES TO CONSOLIDATED FINANCIAL STATEMENTS — (Continued)
The fair values for commitments to extend credit and standby letters of credit are estimated to approximate their aggregate book balance, which is nominal, and therefore are not disclosed.
Fair value estimates are made at a specific point in time, based on relevant market information and information about the financial instrument. These estimates do not reflect any premium or discount that could result from offering for sale the entire holdings of a particular financial instrument.
Fair value estimates are based on existing on- and off-balance sheet financial instruments without attempting to estimate the value of anticipated future business, the value of future earnings attributable to off-balance sheet activities and the value of assets and liabilities that are not considered financial instruments.
Fair value estimates for deposit accounts do not include the value of the core deposit intangible asset resulting from the low-cost funding provided by the deposit liabilities compared to the cost of borrowing funds in the market.
NOTE 23 – ACCUMULATED OTHER COMPREHENSIVE LOSS
A summary of changes in accumulated other comprehensive loss (“AOCL”), net of tax during the years ended December 31 follows:
|
|
Unrealized
Gains (Losses) on Securities Available for Sale |
Dispropor-
tionate Tax Effects from Securities Available for Sale |
Unrealized
Gains on Cash Flow Hedges |
Dispropor-
tionate Tax Effects from Cash Flow Hedges |
Total
|
||||||||||
|
2017
|
|
|
|
|
|
|
|
|
|
|
|
|
|
|
|
|
Balances at beginning of period
|
$
|
(3,310
|
)
|
$
|
(5,798
|
)
|
$
|
—
|
|
$
|
—
|
|
$
|
(9,108
|
)
|
|
Cumulative effect of change in accounting
|
|
300
|
|
|
—
|
|
|
—
|
|
|
—
|
|
|
300
|
|
|
Balances at beginning of period, as adjusted
|
|
(3,010
|
)
|
|
(5,798
|
)
|
|
—
|
|
|
—
|
|
|
(8,808
|
)
|
|
Other comprehensive income before reclassifications
|
|
2,763
|
|
|
—
|
|
|
210
|
|
|
—
|
|
|
2,973
|
|
|
Amounts reclassified from AOCL
|
|
(140
|
)
|
|
—
|
|
|
12
|
|
|
—
|
|
|
(128
|
)
|
|
Net current period other comprehensive income
|
|
2,623
|
|
|
—
|
|
|
222
|
|
|
—
|
|
|
2,845
|
|
|
Disproportionate tax effects due to change in tax rate
|
|
(83
|
)
|
|
83
|
|
|
47
|
|
|
(47
|
)
|
|
—
|
|
|
Reclassification of certain deferred tax effects (1)
|
|
—
|
|
|
(83
|
)
|
|
—
|
|
|
47
|
|
|
(36
|
)
|
|
Balances at end of period
|
$
|
(470
|
)
|
$
|
(5,798
|
)
|
$
|
269
|
|
$
|
—
|
|
$
|
(5,999
|
)
|
|
2016
|
|
|
|
|
|
|
|
|
|
|
|
|
|
|
|
|
Balances at beginning of period
|
$
|
(238
|
)
|
$
|
(5,798
|
)
|
$
|
—
|
|
$
|
—
|
|
$
|
(6,036
|
)
|
|
Other comprehensive loss before reclassifications
|
|
(2,876
|
)
|
|
—
|
|
|
—
|
|
|
—
|
|
|
(2,876
|
)
|
|
Amounts reclassified from AOCL
|
|
(196
|
)
|
|
—
|
|
|
—
|
|
|
—
|
|
|
(196
|
)
|
|
Net current period other comprehensive loss
|
|
(3,072
|
)
|
|
—
|
|
|
—
|
|
|
—
|
|
|
(3,072
|
)
|
|
Balances at end of period
|
$
|
(3,310
|
)
|
$
|
(5,798
|
)
|
$
|
—
|
|
$
|
—
|
|
$
|
(9,108
|
)
|
|
2015
|
|
|
|
|
|
|
|
|
|
|
|
|
|
|
|
|
Balances at beginning of period
|
$
|
162
|
|
$
|
(5,798
|
)
|
$
|
—
|
|
$
|
—
|
|
$
|
(5,636
|
)
|
|
Other comprehensive loss before reclassifications
|
|
(351
|
)
|
|
—
|
|
|
—
|
|
|
—
|
|
|
(351
|
)
|
|
Amounts reclassified from AOCL
|
|
(49
|
)
|
|
—
|
|
|
—
|
|
|
—
|
|
|
(49
|
)
|
|
Net current period other comprehensive loss
|
|
(400
|
)
|
|
—
|
|
|
—
|
|
|
—
|
|
|
(400
|
)
|
|
Balances at end of period
|
$
|
(238
|
)
|
$
|
(5,798
|
)
|
$
|
—
|
|
$
|
—
|
|
$
|
(6,036
|
)
|
| (1) | Amounts reclassified to accumulated deficit due to early adoption of ASU 2018-02. See note #1. |
The disproportionate tax effects from securities available for sale arose primarily due to tax effects of other comprehensive income (“OCI”) in the presence of a valuation allowance against our deferred tax assets and a pretax loss from operations. Generally, the amount of income tax expense or benefit allocated to operations is determined
96
NOTES TO CONSOLIDATED FINANCIAL STATEMENTS — (Continued)
without regard to the tax effects of other categories of income or loss, such as OCI. However, an exception to the general rule is provided when, in the presence of a valuation allowance against deferred tax assets, there is a pretax loss from operations and pretax income from other categories in the current period. In such instances, income from other categories must offset the current loss from operations, the tax benefit of such offset being reflected in operations. Release of material disproportionate tax effects from other comprehensive income to earnings is done by the portfolio method whereby the effects will remain in AOCL as long as we carry a more than insubstantial portfolio of securities available for sale.
A summary of reclassifications out of each component of AOCL for the years ended December 31 follows:
|
AOCL Component
|
Reclassified
From AOCL |
Affected Line Item in
Consolidated Statements of Operations |
||
|
|
(In thousands)
|
|
||
|
2017
|
|
|
|
|
|
Unrealized gains (losses) on securities available for sale
|
|
|
|
|
|
|
$
|
215
|
|
Net gains on securities
|
|
|
|
—
|
|
Net impairment loss recognized in earnings
|
|
|
|
215
|
|
Total reclassifications before tax
|
|
|
|
75
|
|
Income tax expense
|
|
|
$
|
140
|
|
Reclassifications, net of tax
|
|
|
|
|
|
|
|
Unrealized gains on cash flow hedges
|
|
|
|
|
|
|
$
|
18
|
|
Interest expense
|
|
|
|
6
|
|
Income tax expense
|
|
|
$
|
12
|
|
Reclassification, net of tax
|
|
|
$
|
128
|
|
Total reclassifications for the period, net of tax
|
|
|
|
|
|
|
|
|
|
|
|
|
|
2016
|
|
|
|
|
|
Unrealized gains (losses) on securities available for sale
|
|
|
|
|
|
|
$
|
301
|
|
Net gains on securities
|
|
|
|
—
|
|
Net impairment loss recognized in earnings
|
|
|
|
301
|
|
Total reclassifications before tax
|
|
|
|
105
|
|
Income tax expense
|
|
|
$
|
196
|
|
Reclassifications, net of tax
|
|
|
|
|
|
|
|
|
|
|
|
|
|
2015
|
|
|
|
|
|
Unrealized gains (losses) on securities available for sale
|
|
|
|
|
|
|
$
|
75
|
|
Net gains on securities
|
|
|
|
—
|
|
Net impairment loss recognized in earnings
|
|
|
|
75
|
|
Total reclassifications before tax
|
|
|
|
26
|
|
Income tax expense
|
|
|
$
|
49
|
|
Reclassifications, net of tax
|
97
NOTES TO CONSOLIDATED FINANCIAL STATEMENTS — (Continued)
NOTE 24 – INDEPENDENT BANK CORPORATION (PARENT COMPANY ONLY) FINANCIAL INFORMATION
Presented below are condensed financial statements for our parent company.
CONDENSED STATEMENTS OF FINANCIAL CONDITION
|
|
December 31,
|
|||||
|
|
2017
|
2016
|
||||
|
|
(In thousands)
|
|||||
|
ASSETS
|
|
|
|
|
|
|
|
Cash and due from banks
|
$
|
16,454
|
|
$
|
9,515
|
|
|
Interest bearing deposits - time
|
|
5,000
|
|
|
5,000
|
|
|
Investment in subsidiaries
|
|
271,315
|
|
|
259,883
|
|
|
Accrued income and other assets
|
|
8,375
|
|
|
10,489
|
|
|
Total Assets
|
$
|
301,144
|
|
$
|
284,887
|
|
|
|
|
|
|
|
|
|
|
LIABILITIES AND SHAREHOLDERS’ EQUITY
|
|
|
|
|
|
|
|
Subordinated debentures
|
$
|
35,569
|
|
$
|
35,569
|
|
|
Accrued expenses and other liabilities
|
|
500
|
|
|
379
|
|
|
Shareholders’ equity
|
|
265,075
|
|
|
248,939
|
|
|
Total Liabilities and Shareholders’ Equity
|
$
|
301,144
|
|
$
|
284,887
|
|
CONDENSED STATEMENTS OF OPERATIONS
|
|
Year Ended December 31,
|
||||||||
|
|
2017
|
2016
|
2015
|
||||||
|
|
(In thousands)
|
||||||||
|
OPERATING INCOME
|
|
|
|
|
|
|
|
|
|
|
Dividends from subsidiary
|
$
|
16,000
|
|
$
|
5,000
|
|
$
|
—
|
|
|
Interest income
|
|
29
|
|
|
27
|
|
|
72
|
|
|
Other income
|
|
41
|
|
|
153
|
|
|
31
|
|
|
Total Operating Income
|
|
16,070
|
|
|
5,180
|
|
|
103
|
|
|
|
|
|
|
|
|
|
|
|
|
|
OPERATING EXPENSES
|
|
|
|
|
|
|
|
|
|
|
Interest expense
|
|
1,347
|
|
|
1,167
|
|
|
1,021
|
|
|
Administrative and other expenses
|
|
714
|
|
|
554
|
|
|
560
|
|
|
Total Operating Expenses
|
|
2,061
|
|
|
1,721
|
|
|
1,581
|
|
|
Income (Loss) Before Income Tax and Equity in Undistributed Net Income of Subsidiaries
|
|
14,009
|
|
|
3,459
|
|
|
(1,478
|
)
|
|
Income tax expense (benefit)
|
|
1,587
|
|
|
(615
|
)
|
|
(542
|
)
|
|
Income (Loss) Before Equity in Undistributed Net Income of Subsidiaries
|
|
12,422
|
|
|
4,074
|
|
|
(936
|
)
|
|
Equity in undistributed net income of subsidiaries
|
|
8,053
|
|
|
18,692
|
|
|
20,953
|
|
|
Net Income
|
$
|
20,475
|
|
$
|
22,766
|
|
$
|
20,017
|
|
98
NOTES TO CONSOLIDATED FINANCIAL STATEMENTS — (Continued)
CONDENSED STATEMENTS OF CASH FLOWS
|
|
Year Ended December 31,
|
||||||||
|
|
2017
|
2016
|
2015
|
||||||
|
|
(In thousands)
|
||||||||
|
Net Income
|
$
|
20,475
|
|
$
|
22,766
|
|
$
|
20,017
|
|
|
ADJUSTMENTS TO RECONCILE NET INCOME TO NET CASH FROM (USED) IN OPERATING ACTIVITIES
|
|
|
|
|
|
|
|
|
|
|
Deferred income tax expense (benefit)
|
|
2,146
|
|
|
(615
|
)
|
|
(542
|
)
|
|
Share based compensation
|
|
45
|
|
|
29
|
|
|
21
|
|
|
(Increase) decrease in accrued income and other assets
|
|
(32
|
)
|
|
246
|
|
|
5
|
|
|
Increase (decrease) in accrued expenses and other liabilities
|
|
121
|
|
|
1
|
|
|
(6
|
)
|
|
Equity in undistributed net income of subsidiaries
|
|
(8,053
|
)
|
|
(18,692
|
)
|
|
(20,953
|
)
|
|
Total Adjustments
|
|
(5,773
|
)
|
|
(19,031
|
)
|
|
(21,475
|
)
|
|
Net Cash From (Used) in Operating Activities
|
|
14,702
|
|
|
3,735
|
|
|
(1,458
|
)
|
|
|
|
|
|
|
|
|
|
|
|
|
CASH FLOW FROM INVESTING ACTIVITIES
|
|
|
|
|
|
|
|
|
|
|
Purchases of interest bearing deposits - time
|
|
(10,000
|
)
|
|
(7,500
|
)
|
|
(5,000
|
)
|
|
Maturity of interest bearing deposits - time
|
|
10,000
|
|
|
7,500
|
|
|
12,500
|
|
|
Return of capital from subsidiary
|
|
—
|
|
|
18,000
|
|
|
18,500
|
|
|
Net Cash From Investing Activities
|
|
—
|
|
|
18,000
|
|
|
26,000
|
|
|
|
|
|
|
|
|
|
|
|
|
|
CASH FLOW USED IN FINANCING ACTIVITIES
|
|
|
|
|
|
|
|
|
|
|
Dividends paid
|
|
(8,960
|
)
|
|
(7,274
|
)
|
|
(5,896
|
)
|
|
Proceeds from issuance of common stock
|
|
1,776
|
|
|
1,735
|
|
|
1,569
|
|
|
Share based compensation withholding obligation
|
|
(579
|
)
|
|
(627
|
)
|
|
(1,091
|
)
|
|
Repurchase of common stock
|
|
—
|
|
|
(16,854
|
)
|
|
(13,498
|
)
|
|
Net Cash Used in Financing Activities
|
|
(7,763
|
)
|
|
(23,020
|
)
|
|
(18,916
|
)
|
|
Net Increase (Decrease) in Cash and Cash Equivalents
|
|
6,939
|
|
|
(1,285
|
)
|
|
5,626
|
|
|
Cash and Cash Equivalents at Beginning of Year
|
|
9,515
|
|
|
10,800
|
|
|
5,174
|
|
|
Cash and Cash Equivalents at End of Year
|
$
|
16,454
|
|
$
|
9,515
|
|
$
|
10,800
|
|
NOTE 25 – BRANCH SALE
On April 29, 2015 we entered into a Purchase and Assumption Agreement (“PAA”) with Isabella Bank (based in Mt. Pleasant, Michigan). Pursuant to the PAA, on August 28, 2015, we sold the fixed assets, real property and certain other assets of our bank branch located in Midland, Michigan (the “Midland Branch”) to Isabella Bank. The deposit liabilities of the Midland Branch were assumed by Isabella Bank which totaled $8.7 million on the date of sale. Under the terms of the PAA, Isabella Bank paid a premium of $0.6 million (which was equal to 6.0% of the average deposit liabilities of $9.7 million based on the 20-day average ending two business days prior to the closing date of August 28, 2015) and $0.85 million for the real property and fixed assets (including the ATM). The real property and the fixed assets had a net book value of approximately $0.2 million as of August 28, 2015. We recorded a net gain of $1.2 million in the third quarter of 2015 on the sale of the Midland Branch.
NOTE 26 – MEPCO SALE
On December 30, 2016, Mepco, entered into an APA with Seabury Asset Management LLC (“Seabury”). Pursuant to the terms of the APA, we sold our payment plan processing business, payment plan receivables, and certain other assets to Seabury, who also assumed certain liabilities of Mepco. These assets and liabilities were categorized as “held for sale” in the December 31, 2016 Consolidated Statement of Financial Condition. We also recorded a $0.32 million loss related to the sale of these assets in the fourth quarter of 2016.
99
NOTES TO CONSOLIDATED FINANCIAL STATEMENTS — (Continued)
This transaction closed on May 18, 2017, with an effective date of May 1, 2017. As a result of the closing, Mepco sold $33.1 million of net payment plan receivables, $0.5 million of commercial loans, $0.2 million of furniture and equipment and $1.6 million of other assets to Seabury, who also assumed $2.0 million of specified liabilities. We received cash totaling $33.4 million and recorded no gain or loss in 2017 as the assets were sold and the liabilities were assumed at book value.
Assets sold and liabilities assumed were as follows:
|
|
May 1,
2017 |
December 31,
2016 |
||||
|
|
(In thousands)
|
|||||
|
Assets sold
|
|
|
|
|
|
|
|
Payment plan receivables
|
$
|
33,128
|
|
$
|
30,582
|
|
|
Commercial loans
|
|
525
|
|
|
794
|
|
|
Other assets
|
|
1,765
|
|
|
1,984
|
|
|
Total assets
|
$
|
35,418
|
|
$
|
33,360
|
|
|
|
|
|
|
|
|
|
|
Liabilities assumed
|
$
|
1,972
|
|
$
|
718
|
|
NOTE 27 – PENDING ACQUISITION
On December 4, 2017, we entered into an Agreement and Plan of Merger with TCSB Bancorp, Inc. (“TCSB”) (the “Merger Agreement”) providing for a business combination of IBCP and TCSB. The Merger Agreement provides that, upon the terms and subject to the conditions set forth in the Merger Agreement, TCSB will be merged with and into IBCP, with IBCP as the surviving corporation (the “Merger”). In addition, IBCP intends to consolidate Traverse City State Bank, TCSB’s wholly-owned subsidiary bank, with and into the Bank (with the Bank as the surviving institution).
Subject to the terms and conditions of the Merger Agreement, we will pay aggregate Merger consideration of approximately $63.2 million in IBCP common stock or stock options for all of the shares of TCSB common stock and TCSB stock options issued and outstanding immediately before the effective time of the Merger. The Merger consideration is subject to adjustment in certain limited circumstances, as set forth in the Merger Agreement.
Completion of the Merger is subject to certain closing conditions. These include, among others, (i) in the case of both parties, receipt of the requisite approval of TCSB’s shareholders, receipt of required regulatory approvals, the absence of any law or order prohibiting completion of the Merger and the absence of a material adverse effect (as defined in the Merger Agreement), and (ii) in the case of IBCP, the consolidated shareholders’ equity of TCSB must be at least $33 million (subject to adjustment as provided in the Merger Agreement) as of the final statement date (as defined in the Merger Agreement). The Merger Agreement provides certain termination rights for both IBCP and TCSB and further provides that, upon termination of the Merger Agreement under certain circumstances, TCSB will be obligated to pay IBCP a termination fee of approximately $2.5 million.
The proposed transaction has been approved by both the Federal Reserve Bank of Chicago and the Michigan Department of Insurance and Financial Services. A meeting of the TCSB shareholders has been scheduled for March 14, 2018 to consider and vote upon a proposal to approve the merger agreement between IBCP and TSCB. Assuming requisite TCSB shareholder approval and satisfaction of other closing conditions, the merger of IBCP and TCSB is currently expected to be effective on April 1, 2018.
Our 2017 non-interest expenses include $0.3 million of costs incurred through December 31, 2017 related to the Merger. As of December 31, 2017, TCSB Bancorp, Inc. had total assets of $338.5 million, total loans of $291.5 million, total deposits of $280.5 million, and total shareholders’ equity of $34.5 million.
100
QUARTERLY FINANCIAL DATA (UNAUDITED)
A summary of selected quarterly results of operations for the years ended December 31 follows:
|
|
Three Months Ended
|
|||||||||||
|
|
March 31,
|
June 30,
|
September 30,
|
December 31,
|
||||||||
|
|
(In thousands, except per share amounts)
|
|||||||||||
|
2017
|
|
|
|
|
|
|
|
|
|
|
|
|
|
Interest income
|
$
|
23,379
|
|
$
|
23,533
|
|
$
|
25,371
|
|
$
|
26,026
|
|
|
Net interest income
|
|
21,466
|
|
|
21,492
|
|
|
22,912
|
|
|
23,316
|
|
|
Provision for loan losses
|
|
(359
|
)
|
|
583
|
|
|
582
|
|
|
393
|
|
|
Income before income tax
|
|
8,595
|
|
|
8,594
|
|
|
10,018
|
|
|
11,231
|
|
|
Net income
|
|
5,974
|
|
|
5,931
|
|
|
6,859
|
|
|
1,711
|
|
|
|
|
|
|
|
|
|
|
|
|
|
|
|
|
Net income per common share
|
|
|
|
|
|
|
|
|
|
|
|
|
|
Basic
|
|
0.28
|
|
|
0.28
|
|
|
0.32
|
|
|
0.08
|
|
|
Diluted
|
|
0.28
|
|
|
0.27
|
|
|
0.32
|
|
|
0.08
|
|
|
|
|
|
|
|
|
|
|
|
|
|
|
|
|
2016
|
|
|
|
|
|
|
|
|
|
|
|
|
|
Interest income
|
$
|
21,354
|
|
$
|
21,267
|
|
$
|
21,745
|
|
$
|
22,157
|
|
|
Net interest income
|
|
19,763
|
|
|
19,630
|
|
|
19,998
|
|
|
20,250
|
|
|
Provision for loan losses
|
|
(530
|
)
|
|
(734
|
)
|
|
(175
|
)
|
|
130
|
|
|
Income before income tax
|
|
6,057
|
|
|
9,049
|
|
|
9,352
|
|
|
8,443
|
|
|
Net income
|
|
4,100
|
|
|
6,438
|
|
|
6,373
|
|
|
5,855
|
|
|
|
|
|
|
|
|
|
|
|
|
|
|
|
|
Net income per common share
|
|
|
|
|
|
|
|
|
|
|
|
|
|
Basic
|
|
0.19
|
|
|
0.30
|
|
|
0.30
|
|
|
0.28
|
|
|
Diluted
|
|
0.19
|
|
|
0.30
|
|
|
0.30
|
|
|
0.27
|
|
During the fourth quarter of 2017, we recognized a remeasurement of our net deferred tax assets recording an increase in income tax expense of $6.0 million (see note #13). During the fourth quarter of 2016, we recognized a recovery of impairment on our capitalized mortgage loan servicing rights of $2.4 million (see note #4) and recorded a litigation settlement expense of $2.3 million (see note #11).
QUARTERLY SUMMARY (UNAUDITED)
|
|
Reported Sales Prices of Common Shares
|
Cash Dividends
Declared |
||||||||||||||||||||||
|
|
2017
|
2016
|
||||||||||||||||||||||
|
|
High
|
Low
|
Close
|
High
|
Low
|
Close
|
2017
|
2016
|
||||||||||||||||
|
First quarter
|
$
|
22.40
|
|
$
|
19.25
|
|
$
|
20.70
|
|
$
|
16.15
|
|
$
|
13.89
|
|
$
|
14.55
|
|
$
|
0.10
|
|
$
|
0.08
|
|
|
Second quarter
|
|
23.65
|
|
|
19.75
|
|
|
21.75
|
|
|
15.32
|
|
|
13.42
|
|
|
14.51
|
|
|
0.10
|
|
|
0.08
|
|
|
Third quarter
|
|
22.90
|
|
|
18.50
|
|
|
22.65
|
|
|
17.00
|
|
|
14.32
|
|
|
16.83
|
|
|
0.10
|
|
|
0.08
|
|
|
Fourth quarter
|
|
23.60
|
|
|
20.90
|
|
|
22.35
|
|
|
22.25
|
|
|
16.33
|
|
|
21.70
|
|
|
0.12
|
|
|
0.10
|
|
We have approximately 1,400 holders of record of our common stock. Our common stock trades on the Nasdaq Global Select Market System under the symbol “IBCP.” The prices shown above are supplied by Nasdaq and reflect the inter-dealer prices and may not include retail markups, markdowns or commissions. There may have been transactions or quotations at higher or lower prices of which we are not aware.
In addition to limitations imposed by the provisions of the Michigan Business Corporation Act (which, among other things, limits us from paying dividends to the extent we are insolvent), our ability to pay dividends is limited by our ability to obtain funds from our Bank and by regulatory capital guidelines applicable to us (see note #20).
101
EXHIBIT 21
|
State of Incorporation
|
|
|
IBC Capital Finance III
Ionia, Michigan |
Delaware
|
|
IBC Capital Finance IV
Ionia, Michigan |
Delaware
|
|
Midwest Guaranty Trust I
Ionia, Michigan |
Delaware
|
|
Independent Bank
Grand Rapids, Michigan |
Michigan
|
|
IB Wealth Management, Inc., Grand Rapids, Michigan
(a subsidiary of Independent Bank) |
Michigan
|
|
IB Insurance Services, Inc., Grand Rapids, Michigan
(a subsidiary of Independent Bank) |
Michigan
|
|
Independent Title Services, Inc., Grand Rapids, Michigan
(a subsidiary of Independent Bank Corporation) |
Michigan
|
|
Independent Life Insurance Trust, Grand Rapids, Michigan
(a subsidiary of Independent Bank) |
Michigan
|
EXHIBIT 23
|
/s/ Crowe Horwath LLP
|
EXHIBIT 31.1
| 1. |
I have reviewed this annual report on Form 10-K of Independent Bank Corporation;
|
| 2. |
Based on my knowledge, this report does not contain any untrue statement of a material fact or omit to state a material fact necessary to make the statements made, in light of the circumstances under which such statements were made, not misleading with respect to the period covered by this report;
|
| 3. |
Based on my knowledge, the financial statements, and other financial information included in this report, fairly present in all material respects the financial condition, results of operations and cash flows of the registrant as of, and for, the periods presented in this report;
|
| 4. |
The registrant's other certifying officer and I are responsible for establishing and maintaining disclosure controls and procedures (as defined in Exchange Act Rules 13a-15(e) and 15d-15(e)) and internal control over financial reporting (as defined in Exchange Act Rules 13a-15(f) and 15.15(f)) for the registrant and have:
|
| a) |
designed such disclosure controls and procedures, or caused such disclosure controls and procedures to be designed under our supervision, to ensure that material information relating to the registrant, including its consolidated subsidiaries, is made known to us by others within those entities, particularly during the period in which this report is being prepared;
|
| b) |
designed such internal control over financial reporting, or caused such internal control over financial reporting to be designed under our supervision, to provide reasonable assurance regarding the reliability of financial reporting and the preparation of financial statements for external purposes in accordance with generally accepted accounting principles;
|
| c) |
evaluated the effectiveness of the registrant's disclosure controls and procedures and presented in this report our conclusions about the effectiveness of the disclosure controls and procedures, as of the end of the period covered by this report based on such evaluation; and
|
| d) |
disclosed in this report any change in the registrant's internal control over financial reporting that occurred during the registrant's most recent fiscal quarter (the registrant's fourth fiscal quarter in the case of an annual report) that has materially affected, or is reasonably likely to materially affect, the registrant's internal control over financial reporting; and
|
| 5. |
The registrant's other certifying officer and I have disclosed, based on our most recent evaluation of internal control over financial reporting, to the registrant's auditors and the audit committee of the registrant's board of directors (or persons performing the equivalent functions):
|
| a) |
all significant deficiencies and material weaknesses in the design or operation of internal control over financial reporting which are reasonably likely to adversely affect the registrant's ability to record, process, summarize and report financial information; and
|
| b) |
any fraud, whether or not material, that involves management or other employees who have a significant role in the registrant's internal controls over financial reporting.
|
|
Date: March 7, 2018
|
/s/ William B. Kessel
|
| William B. Kessel President and Chief Executive Officer |
EXHIBIT 31.2
| 1. |
I have reviewed this annual report on Form 10-K of Independent Bank Corporation;
|
| 2. |
Based on my knowledge, this report does not contain any untrue statement of a material fact or omit to state a material fact necessary to make the statements made, in light of the circumstances under which such statements were made, not misleading with respect to the period covered by this report;
|
| 3. |
Based on my knowledge, the financial statements, and other financial information included in this report, fairly present in all material respects the financial condition, results of operations and cash flows of the registrant as of, and for, the periods presented in this report;
|
| 4. |
The registrant's other certifying officer and I are responsible for establishing and maintaining disclosure controls and procedures (as defined in Exchange Act Rules 13a-15(e) and 15d-15(e)) and internal control over financial reporting (as defined in Exchange Act Rules 13a-15(f) and 15.15(f)) for the registrant and have:
|
| a) |
designed such disclosure controls and procedures, or caused such disclosure controls and procedures to be designed under our supervision, to ensure that material information relating to the registrant, including its consolidated subsidiaries, is made known to us by others within those entities, particularly during the period in which this report is being prepared;
|
| b) |
designed such internal control over financial reporting, or caused such internal control over financial reporting to be designed under our supervision, to provide reasonable assurance regarding the reliability of financial reporting and the preparation of financial statements for external purposes in accordance with generally accepted accounting principles;
|
| c) |
evaluated the effectiveness of the registrant's disclosure controls and procedures and presented in this report our conclusions about the effectiveness of the disclosure controls and procedures, as of the end of the period covered by this report based on such evaluation; and
|
| d) |
disclosed in this report any change in the registrant's internal control over financial reporting that occurred during the registrant's most recent fiscal quarter (the registrant's fourth fiscal quarter in the case of an annual report) that has materially affected, or is reasonably likely to materially affect, the registrant's internal control over financial reporting; and
|
| 5. |
The registrant's other certifying officer and I have disclosed, based on our most recent evaluation of internal control over financial reporting, to the registrant's auditors and the audit committee of the registrant's board of directors (or persons performing the equivalent functions):
|
| a) |
all significant deficiencies and material weaknesses in the design or operation of internal control over financial reporting which are reasonably likely to adversely affect the registrant's ability to record, process, summarize and report financial information; and
|
| b) |
any fraud, whether or not material, that involves management or other employees who have a significant role in the registrant's internal controls over financial reporting.
|
|
Date: March 7, 2018
|
/s/ Robert N. Shuster
|
| Robert N. Shuster Chief Financial Officer |
EXHIBIT 32.1
| (1) |
The annual report on Form 10-K for the annual period ended December 31, 2017, which this statement accompanies, fully complies with requirements of Section 13(a) or 15(d) of the Securities Exchange Act of 1934 and;
|
| (2) |
The information contained in this annual report on Form 10-K for the annual period ended December 31, 2017, fairly presents, in all material respects, the financial condition and results of operations of Independent Bank Corporation.
|
|
Date: March 7, 2018
|
/s/ William B. Kessel
|
| William B. Kessel President and Chief Executive Officer |
EXHIBIT 32.2
| (1) |
The annual report on Form 10-K for the annual period ended December 31, 2017, which this statement accompanies, fully complies with requirements of Section 13(a) or 15(d) of the Securities Exchange Act of 1934 and;
|
| (2) |
The information contained in this annual report on Form 10-K for the annual period ended December 31, 2017, fairly presents, in all material respects, the financial condition and results of operations of Independent Bank Corporation.
|
|
Date: March 7, 2018
|
/s/ Robert N. Shuster
|
| Robert N. Shuster Chief Financial Officer |